Publication-Ready Academic Research Manuscript
March 2026
This manuscript develops an integrated institutional framework for a structural economic transition driven by the simultaneous compression of intelligence costs and coordination costs. The first force is AI-enabled labor compression in knowledge-intensive tasks; the second is programmable settlement infrastructure that reduces search, contracting, enforcement, settlement latency, and reconciliation overhead. Building on transaction-cost economics and macro distribution theory, the paper defines an aggregate surplus identity S = LC × C0 and models surplus allocation across three channels: corporate profit (α), micro-enterprise income (β), and infrastructure rent (γ), with α + β + γ = 1. The central claim is that the distribution of this surplus, not productivity growth alone, is the decisive macro variable for the decade ahead. The manuscript presents microeconomic parameterization, general-equilibrium labor-share dynamics, sectoral implications, governance redesign, scenario architecture for 2026-2036, portfolio allocation implications, and policy measurement reforms. The analysis indicates a likely hybrid equilibrium in which incumbents retain significant strategic roles while firm boundaries become more modular and infrastructure concentration rises. Distributional outcomes depend on regulatory design, open-model diffusion, and institutional adaptation velocity.
Eisenberg, Barry. 2026. The Convergence Economy: Intelligence, Settlement, and the Re-Architecture of the Firm. Publication-ready academic manuscript.
March 2026
The global economy is entering a structural inflection of a kind that occurs rarely and matters disproportionately. Unlike cyclical contractions or sector-specific disruptions, what is now underway involves the simultaneous and persistent compression of two foundational economic inputs: the cost of generating cognitive output and the cost of coordinating exchange. The first is driven by the diffusion of general-purpose artificial intelligence. The second is driven by programmable settlement infrastructure — smart contracts, tokenized payment rails, and real-time clearing mechanisms — that materially reduces the friction of transacting across institutional, geographic, and temporal boundaries.
Either force, operating in isolation, would represent a meaningful productivity event. AI reducing the labor intensity of knowledge work would, on its own, alter the cost structures of every sector that competes on intellectual capital. Programmable settlement reducing coordination friction would, on its own, restructure supply chains, compress financial intermediation, and expand the feasible scope of distributed production. But these forces are not operating in isolation. They are compressing simultaneously, and their interaction produces effects that are non-additive. The resulting macro-institutional environment — the Convergence Economy — demands an analytical framework calibrated to its specific structural properties, rather than one borrowed from prior periods of technological change.
The central economic consequence of this convergence is the generation of surplus at a scale that is historically unusual. The surplus arises because two major cost inputs — cognitive labor and coordination overhead — are being reduced faster than output prices in competitive markets can adjust. In a frictionless economy, this surplus would immediately dissipate through competition. In the actual economy, institutional rigidities, regulatory lags, first-mover advantages, and infrastructure concentration mean that surplus persists, at least in the medium term, before being competed away.
Defining the Surplus and Its Distribution
Let the baseline compressible labor cost across an enterprise or economic sector be denoted C₀. This is the labor expenditure that is, in principle, substitutable by AI-enabled tooling — chiefly knowledge-work tasks: analysis, synthesis, drafting, coding, classification, and structured judgment. Let the effective labor compression achieved through AI integration be LC, expressed as a fraction of C₀. Then the annual surplus generated by intelligence compression is:
S = LC × C₀
This surplus is not retained automatically by any single constituency. Its distribution is a function of market structure, bargaining power, regulatory regime, and the configuration of ownership over the infrastructure that delivers the compression. The distribution identity can be written:
S = αP + βM + γI
Where: - α (alpha) captures the share of surplus accruing to corporate profit — the incumbent firm capturing margin expansion from reduced headcount or reallocated labor - β (beta) captures the share accruing to micro-enterprise income — distributed operators, freelancers, and independent specialists enabled by lower minimum scale thresholds and cheaper coordination - γ (gamma) captures infrastructure rent — the share flowing to the owners of AI platforms, settlement networks, and the underlying compute and protocol infrastructure
The sum of these coefficients is constrained to unity by construction: α + β + γ = 1. But their individual values are not fixed by technology alone. They are determined by the institutional and political economy that surrounds the technology. A high-α outcome — one in which corporate incumbents capture the dominant share of surplus — produces margin expansion, labor displacement without redistribution, and rising concentration. A high-β outcome — one in which micro-enterprise formations absorb a significant share — produces labor market fragmentation, the proliferation of independent operators, and a structural shift in how work is organized without necessarily reducing aggregate employment. A high-γ outcome — infrastructure rent dominance — concentrates returns among platform and protocol operators, raising questions about competitive access and systemic dependency.
The Decisive Variable of the Decade
The distribution of surplus S is therefore not merely a distributional question in the ethical sense. It is the decisive macro variable for the next decade. The coefficients α, β, and γ determine: the trajectory of labor’s share in national income; the degree of corporate profit concentration and the valuation of incumbent firms; the viability of new enterprise models organized around AI-enabled micro-operators; and the political sustainability of the transition, given that rapid compression of labor income without compensating income streams is historically associated with institutional instability.
This manuscript offers an integrated macro-institutional framework for understanding the Convergence Economy in its current early phase and for deriving strategic guidance appropriate to the conditions it is creating. It is addressed to three audiences: corporate boards and executive leadership teams navigating the re-architecture of the firm; policymakers assessing the distributional and stability implications of rapid structural change; and institutional investors positioning portfolios for a transition that is structural rather than cyclical.
Nine Strategic Imperatives
Nine strategic imperatives follow from the Convergence Economy framework and will be developed across the sections that follow:
Minimum efficient scale is declining in knowledge sectors. The scale required to produce competitive cognitive outputs is falling, which means that competitive moats built on headcount and specialization depth are eroding. Firm strategy must be reoriented accordingly.
The redistribution question is the macro variable. The distribution coefficients α, β, and γ will shape aggregate demand, labor market structure, and political economy in ways that dwarf the direct productivity effects of AI diffusion. Ignoring redistribution dynamics produces systematically incomplete forecasts.
Corporate advantage shifts from labor aggregation to orchestration. As the productivity of external operators rises and coordination costs fall, the firm’s comparative advantage migrates from assembling and managing large labor pools to curating, directing, and integrating distributed networks of capability.
The leverage pyramid model is structurally vulnerable. Professional service models built on the multiplication of junior labor — associate-intensive, pyramid-structured billing — face direct compression in their core value mechanism. This is not a cyclical headcount pressure; it is a structural challenge to the economic logic of the model.
Infrastructure is the strategic chokepoint. As both intelligence and coordination migrate to platform and protocol infrastructure, the owners of that infrastructure — AI foundation model providers, settlement network operators, compute hyperscalers — occupy a γ-capturing position that is likely to be durable and politically contested.
Risk architecture must evolve. The compression of coordination friction creates new categories of operational and systemic risk: smart contract failure, oracle manipulation, AI model brittleness, and multi-rail settlement disruption. Existing risk frameworks are calibrated for a higher-friction environment and require revision.
Labor market transition will be uneven. Compression falls unevenly across task types, geographies, and credential structures. The junior-tier knowledge worker faces acute substitution pressure. Senior judgment and relationship-intensive work faces a different, and potentially more favorable, dynamic. Blanket narratives of displacement overstate and understate simultaneously.
Capital allocation implications are non-trivial. The structural repricing of knowledge-work output, the compression of coordination costs, and the expansion of AI-native enterprise models alter the relative attractiveness of asset classes, sectors, and corporate structures in ways that require revised allocation frameworks.
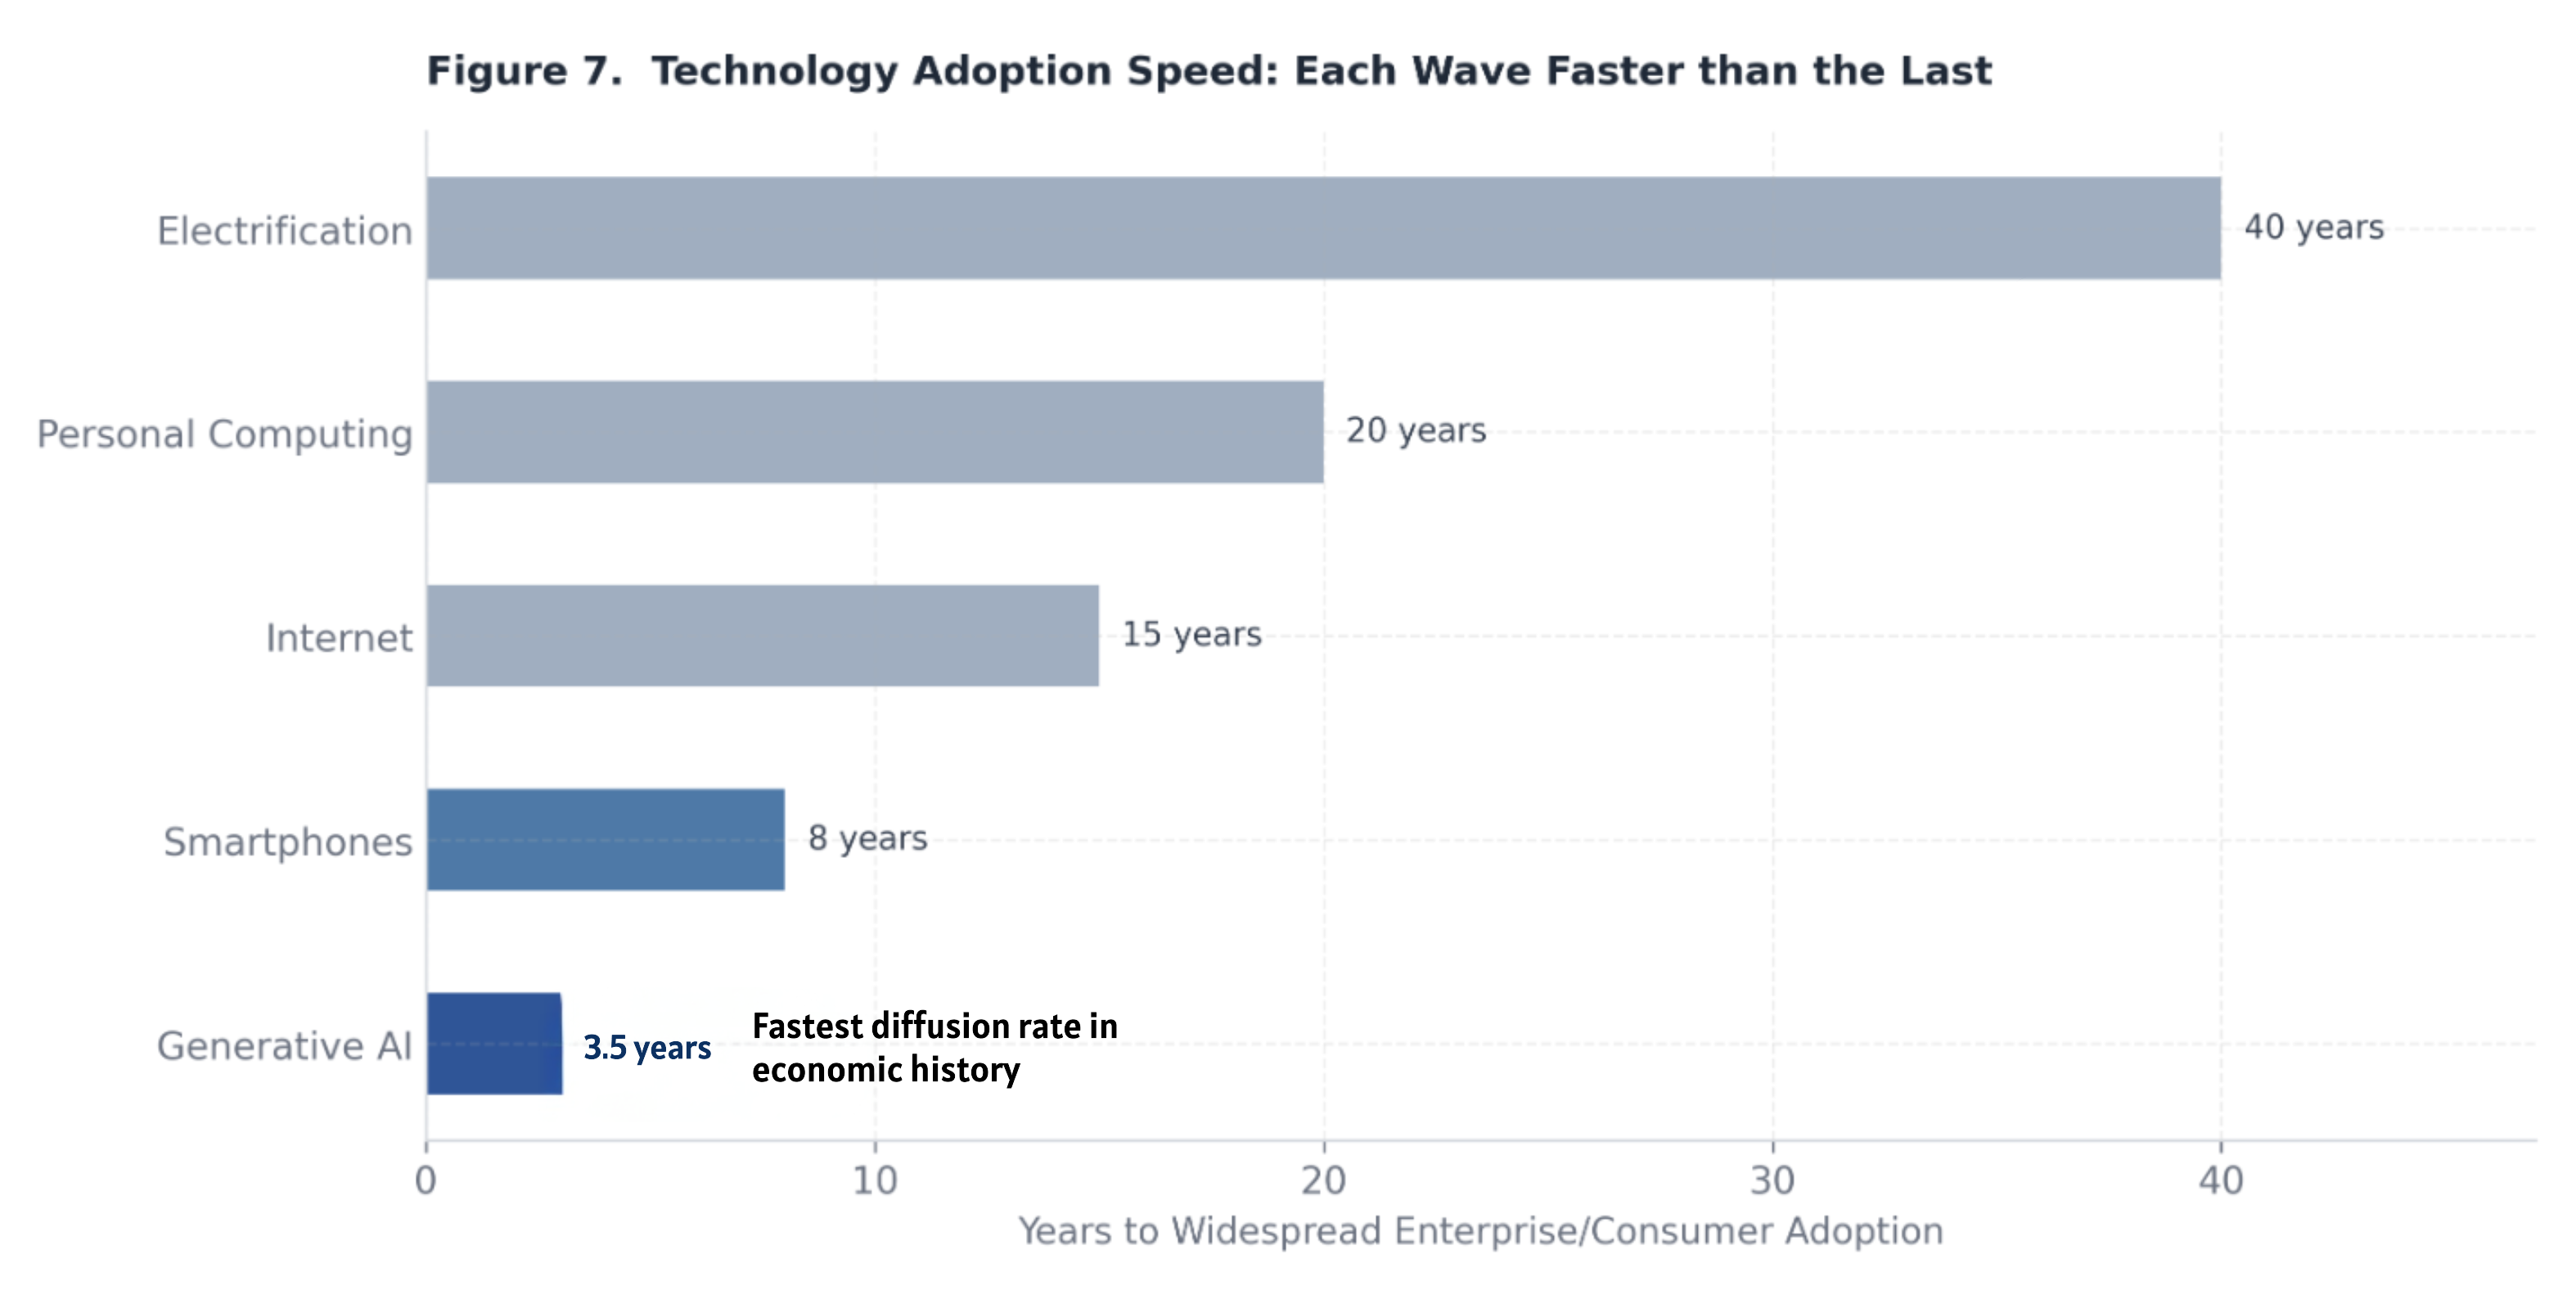
The decade ahead is structural, not cyclical. The forces at work are not mean-reverting. Prior productivity cycles — electrification, personal computing, internet diffusion — were each followed by multi-decade adjustments in firm structure, labor markets, and capital allocation. The present inflection will be no different in character, even if it is faster in pace.
The sections that follow develop each of these themes analytically. Sections 2 through 4 lay the microeconomic and transaction-cost foundations. Subsequent sections address the implications for firm structure, labor markets, capital allocation, and the policy environment. The framework offered here does not claim predictive certainty; structural transitions of this magnitude resist precise forecasting. What it does claim is that the analytical tools governing strategic planning in the pre-convergence period are insufficient for navigating the one now underway.
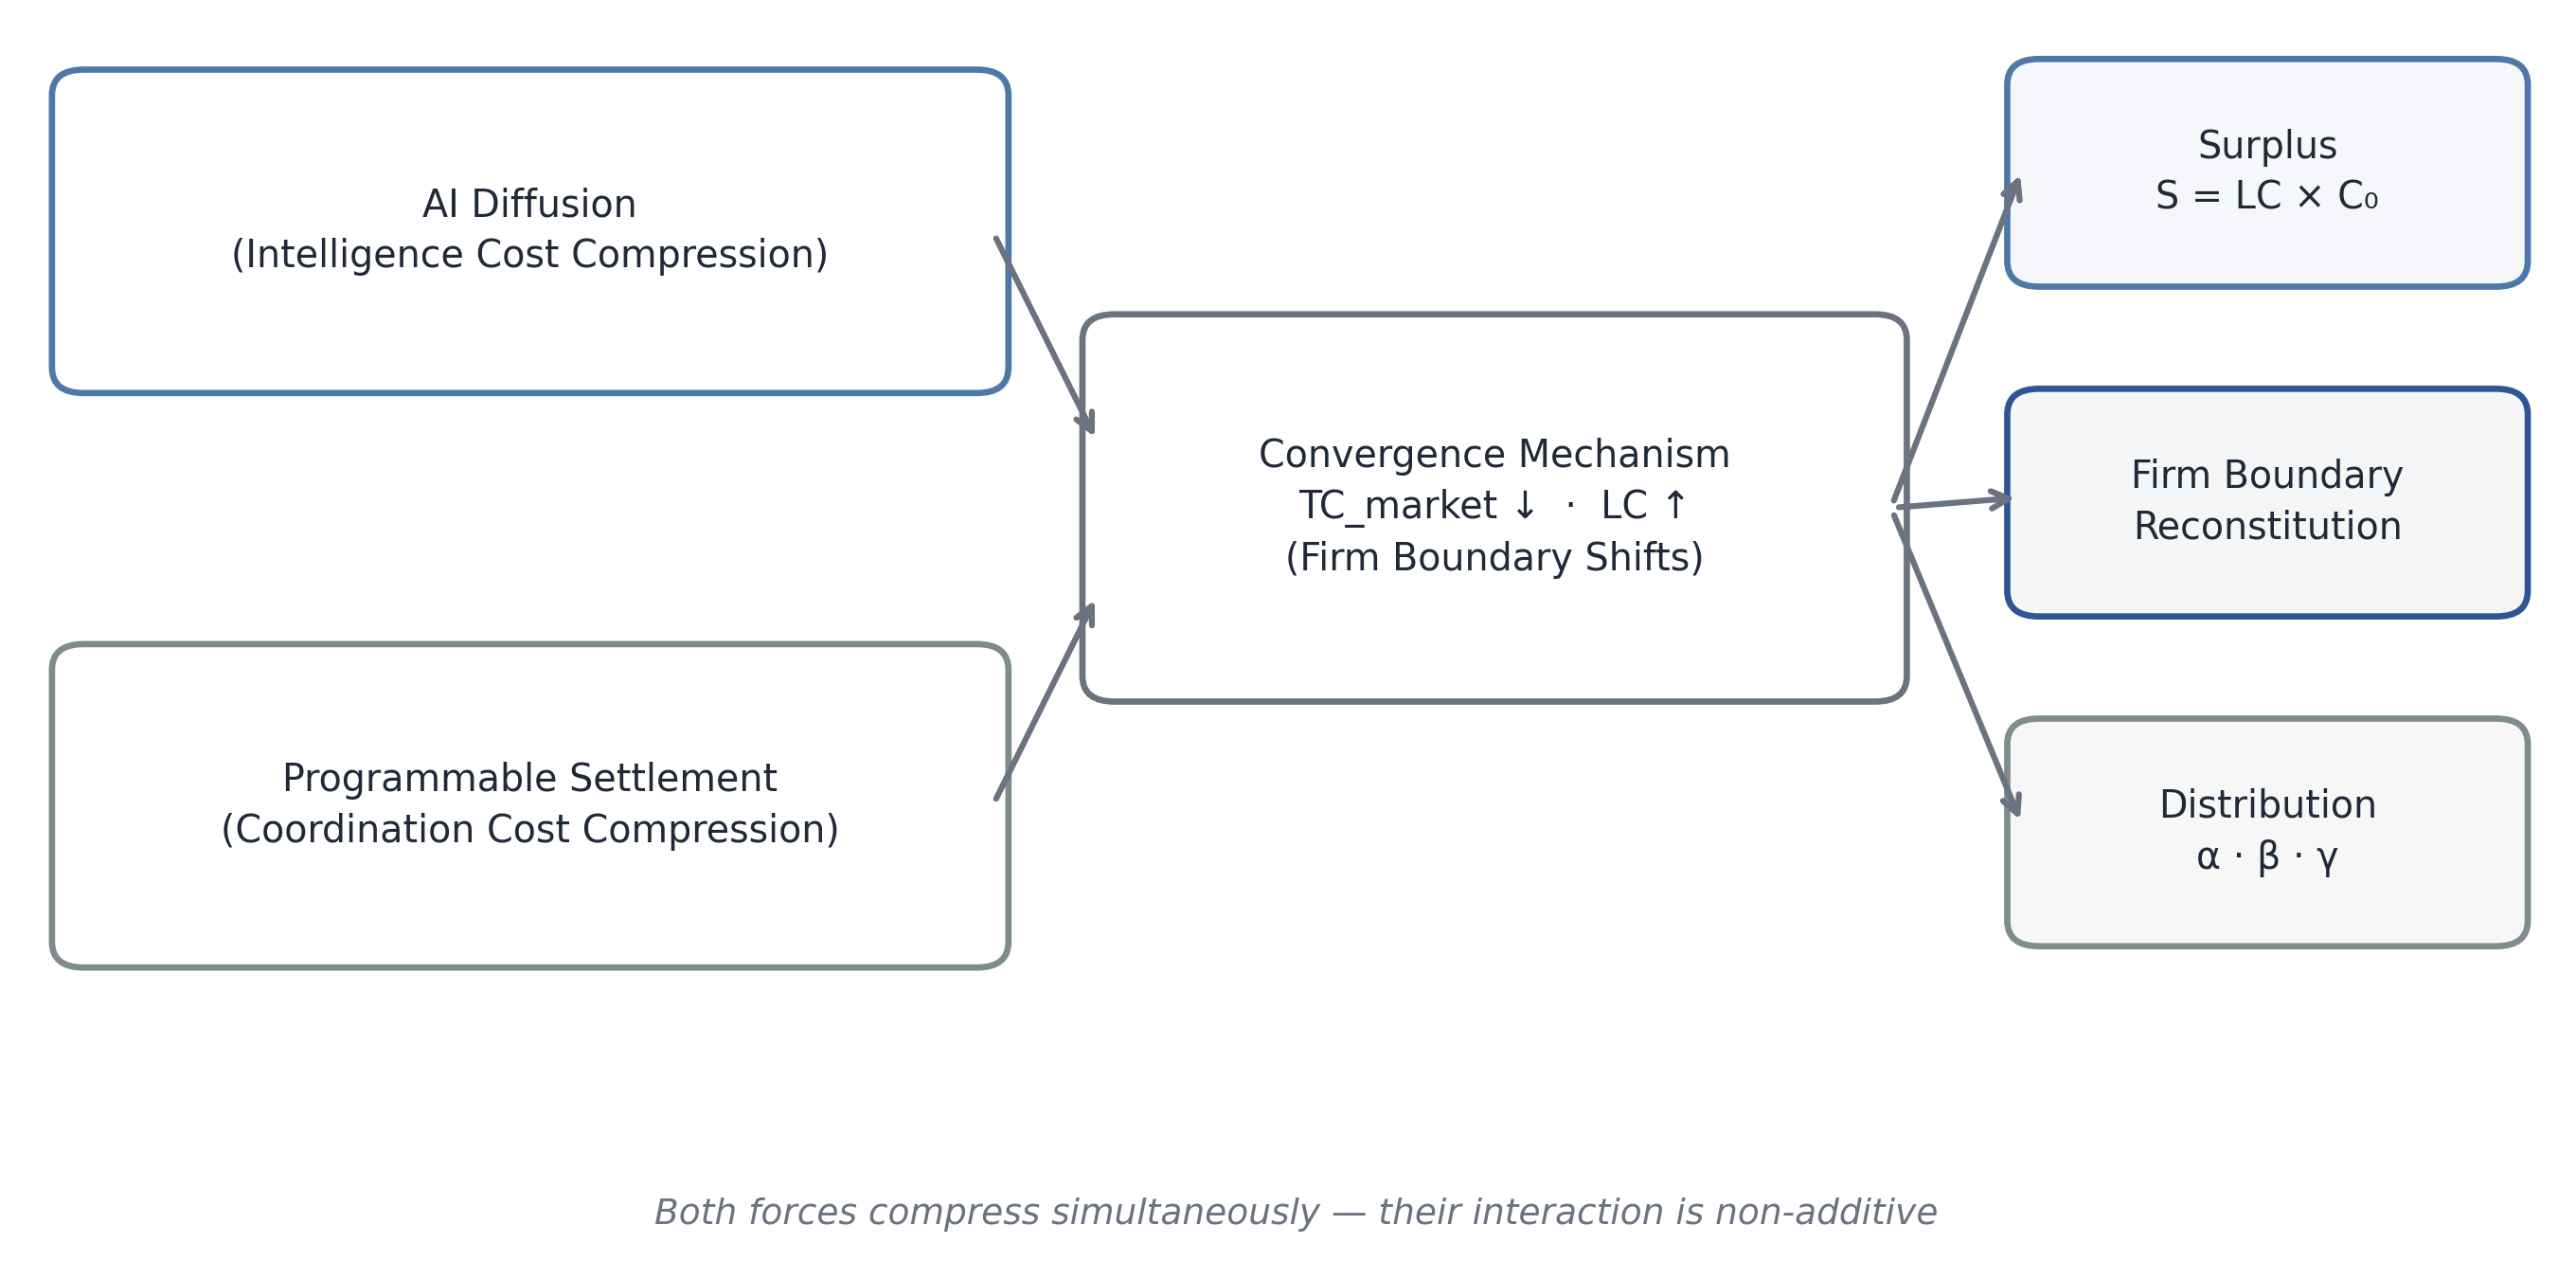
Figure 1. Structural logic of concurrent intelligence and coordination compression and downstream institutional effects. The proposition that general-purpose technologies reorganize the structure of production is not novel. Economic historians from Schumpeter through Mokyr to David have demonstrated, with considerable empirical support, that certain technological advances — characterized by their breadth of applicability, their capacity to generate productivity improvements across multiple unrelated sectors, and their tendency to stimulate complementary innovations — produce systemic restructuring rather than incremental adjustment. What is less consistently appreciated is the mechanism through which this restructuring operates: general-purpose technologies generate durable structural change specifically when they alter the relative costs of the fundamental inputs to production in a persistent and material way. It is this input-cost repricing, and not simply the technology itself, that forces the reorganization of the firm.
Three Prior Waves and Their Structural Logic
Mechanization, the first industrial wave, compressed the cost of applying physical force to productive tasks. The immediate consequence was not simply that individual workers became more productive; it was that the minimum scale required to produce competitively in manufacturing fell, then rose, as power equipment became less expensive but also more complex to operate, maintain, and integrate. The firm consolidated because the coordination of mechanized production required spatial proximity and hierarchical management structures that were economically justified by the enormous reduction in per-unit physical labor cost. The factory — a site of aggregated labor under centralized supervision — became the dominant institutional form not because of ideology or convention but because it was the organizational structure best suited to capturing the surplus that mechanization created.
Electrification, the second wave, compressed the cost of deploying energy across a production process. Unlike steam, electricity was divisible, transportable within a facility, and controllable at the point of use. This allowed the reorganization of factory floors, the extension of productive activity into the evening, and eventually the emergence of service industries dependent on continuous power availability. What electrification did not do, in its early phases, was reduce the coordination costs that kept the firm as the primary production unit. The difficulty of contracting across firm boundaries — communicating specifications, verifying quality, enforcing delivery — remained high. The gains from electrification were therefore captured primarily within existing firm structures, which expanded in scale but did not fundamentally reconstitute their organizational logic. The vertically integrated industrial corporation, dominant through much of the twentieth century, was in part a response to high coordination costs that technology had not yet addressed.
The internet wave differed in a crucial respect. It compressed the cost of distributing information and reduced, though did not eliminate, information asymmetries between transacting parties. This made certain categories of market coordination more efficient: price discovery, supplier comparison, buyer verification, and the matching of supply with demand across geographies. E-commerce, platform intermediation, and the proliferation of networked services all reflected this compression of distribution and information cost. Firm boundaries did shift at the margin — outsourcing accelerated, global supply chains deepened, and platform business models emerged that organized production through markets rather than hierarchies. But the core economic logic of the firm remained intact. Coordination of complex, high-value, knowledge-intensive work still required internalization, because the transaction costs of contracting for such work across firm boundaries remained high. The internet lowered TC_market for standardized, verifiable outputs; it did not resolve the contracting problem for complex cognitive tasks.
The Present Moment: Three Structural Distinctions
The current inflection differs from these prior waves in three specific and analytically important respects.
First, the scope of substitution has extended to high-skill cognitive tasks. Mechanization substituted for physical labor. Early computing substituted for clerical and computational routine. The internet substituted for information intermediation. AI, in its current generative and agentic forms, substitutes for — or substantially augments — tasks that previously required advanced judgment, synthesis, drafting, and structured analysis. These are the tasks that formed the productive core of the knowledge economy’s most valuable sectors: professional services, financial analysis, legal research, software engineering, scientific inquiry, strategic advisory. Prior technology waves left these tasks largely untouched, which is why the knowledge economy continued to command premium labor returns even through the internet era. The present wave does not.
Second, the compression of intelligence cost and coordination cost is occurring concurrently, not sequentially. Prior waves repriced single input categories over extended periods. The current inflection is simultaneously repricing both the cost of generating cognitive output and the cost of coordinating exchange. This simultaneity means that the two primary barriers to the modularization of the firm — the high cost of external cognitive labor and the high transaction cost of coordinating it — are falling at the same time. The result is not a marginal shift in firm boundaries but a potential structural discontinuity in the economic logic of why the firm exists at the scale it does.
Third, diffusion is occurring in quarters rather than decades. Electrification took roughly four decades to diffuse through U.S. manufacturing. The internet took fifteen years to produce significant organizational change in most industries. The current cycle, measured from the commercial availability of capable large-language models in late 2022 to meaningful enterprise deployment, has proceeded in approximately eighteen months for early adopters and is tracking toward broad-sector integration within three to five years. The speed of diffusion compresses the adjustment period available to incumbents, labor markets, and regulatory institutions.
Transaction-Cost Theory and the Reconstitution of the Firm
The theoretical framework best suited to analyzing these structural implications is the transaction-cost economics of Coase and Williamson. In the Coasian framework, the boundary of the firm is determined by the comparison between the cost of organizing an additional transaction within the firm (TC_internal) and the cost of conducting that transaction through the market (TC_market). Firms internalize activities when TC_market > TC_internal, and externalize — or refrain from internalizing — when the inequality reverses.
Williamson extended this framework to account for asset specificity, bounded rationality, and opportunism as the primary drivers of transaction cost. Activities requiring highly specific assets, complex contracting, and difficult verification are internalized; standardized, verifiable, commoditizable activities are externalized to markets or networks. The post-war corporation’s vertical integration, the professional services firm’s employment of large junior labor pools, and the corporate function’s reluctance to outsource knowledge-intensive work all reflect high TC_market in their respective activity domains.
The convergence of AI and programmable settlement alters both sides of this inequality in a coordinated way. Programmable settlement — through smart contracts, automated payment rails, and on-chain verification mechanisms — directly reduces TC_market by lowering search costs, eliminating settlement latency, automating enforcement, and enabling conditional payments tied to verifiable outputs. AI simultaneously reduces the minimum cognitive capability required to perform complex tasks, effectively reducing the asset-specificity premium that previously made external contracting for knowledge work prohibitively costly. As AI tools normalize output quality across a wider population of practitioners, the contracting problem for knowledge work becomes more tractable: outputs become more verifiable, quality distributions narrow, and opportunism risk diminishes.
The combined effect is that the inequality TC_market > TC_internal narrows. Where it narrows sufficiently, selective externalization — the modularization of previously internalized functions to external networks of AI-enabled operators — becomes economically rational. The firm does not disappear in this logic; it reconstitutes as an orchestration layer. Its strategic core — the activities that involve proprietary judgment, irreplaceable relationships, and genuine asset specificity — remains internal. Its standardizable outputs, previously justified as internal by high TC_market, migrate to organized external markets.
This does not mean all firms modularize simultaneously or to the same degree. Regulatory constraints, trust costs, reputational capital, and organizational inertia will produce substantial heterogeneity in the pace and extent of reconstitution. Firms in highly regulated industries, those whose outputs are difficult to verify externally, and those with deep institutional relationships built on employed labor will modularize more slowly. But the direction of the equilibrium force is clear: as TC_market falls toward a low bound driven by programmable settlement and AI-enabled verification, the optimal organizational form shifts away from the large integrated employment structure and toward the curated production network.
The Counter-Hypothesis and Its Limitations
Analytical credibility requires acknowledging the strongest version of the counter-argument. If AI generates sufficient demand for new categories of labor — roles that do not exist today, tasks that emerge from the productivity gains themselves, or complementary human skills that AI diffusion elevates in value — then the net effect on employment may be positive, the redistribution thesis may be overstated, and the firm reconstitution dynamic may be more incremental than structural. This is not an empty argument; prior general-purpose technology waves did generate new employment categories that partially or fully absorbed displaced workers over multi-decade horizons.
The historical analogy, however, has important limits in the present context. Prior waves primarily automated routine, codifiable tasks, leaving high-skill cognitive work as the destination sector for displaced workers. The current wave is compressing the destination sector itself. The adjustment mechanism that operated in prior transitions — upskilling into cognitive labor — is less available when cognitive labor is itself the object of compression. New roles will emerge; the question is whether they will emerge at sufficient scale, in accessible geographies, and at sufficiently compressed wage premia to prevent significant distributional stress in the interim. This manuscript treats the counter-hypothesis as a meaningful qualifier on the pace and intensity of structural change, but not as a refutation of its direction.
The productivity claims associated with AI adoption vary widely across enterprises, sectors, and methodologies. Pilot-study results, vendor benchmarks, and academic experiments occupy different positions in the distribution of reported outcomes, and credible institutional analysis requires a framework that distinguishes structural signal from implementation noise. This section develops the microeconomic foundations of intelligence compression — the process by which AI integration reduces the effective labor input required for a given bundle of cognitive tasks — and situates empirical observations within that framework.
The Compression Model
Consider an enterprise or practice unit whose output is defined by a task bundle T. This bundle consists of the set of cognitive activities required to produce the unit’s deliverable — analysis, drafting, synthesis, classification, structured reasoning, and the associated coordination and quality-review activities. In the pre-AI baseline, the labor input required to complete T is L₀, measured in full-time equivalent hours or equivalent cost units. Following AI integration, the effective labor input falls to L₁. The raw compression ratio is:
Δ = (L₀ − L₁) / L₀
This is the fraction by which labor input has been reduced holding output quality constant. Δ captures the theoretical productivity gain available from AI tooling for this task bundle, under conditions of full adoption and frictionless implementation.
In practice, Δ is not the directly deployable measure of productive surplus, for two reasons. First, not all of the compressed labor input translates directly into usable output. Productivity gains may be partially consumed by quality review cycles, model prompting overhead, error correction, and the organizational learning costs of integrating AI into existing workflows. This modulation is captured by the parameter φ (phi), the usable-output factor, defined as the fraction of raw AI-generated output that meets delivery standards without additional substantial labor investment. φ ranges from 0 to 1, with higher values indicating more mature and well-integrated AI deployment.
Second, the conversion of raw labor compression into headcount or cost reduction is not mechanical. Enterprises face adjustment costs, contractual obligations, regulatory constraints, and the legitimate need to retain surge capacity and institutional knowledge. The fraction of gross compression that materializes as realized cost reduction or redeployable capacity is captured by ε (epsilon), the headcount elasticity — the degree to which labor input can actually be reduced or redeployed in response to the compression available.
The effective compression rate, representing the portion of labor cost that can be deployed as productive surplus, is therefore:
LC = ε × (Δ × φ)
And the annual surplus generated at the enterprise level, as introduced in Section 1, is:
S = LC × C₀
Empirical Calibration of Parameters
Enterprise pilot observations across early adopters in professional services, financial analysis, software engineering, and structured knowledge work provide an initial empirical calibration of these parameters, acknowledging that this evidence base is early-stage and will expand and refine over the medium term.
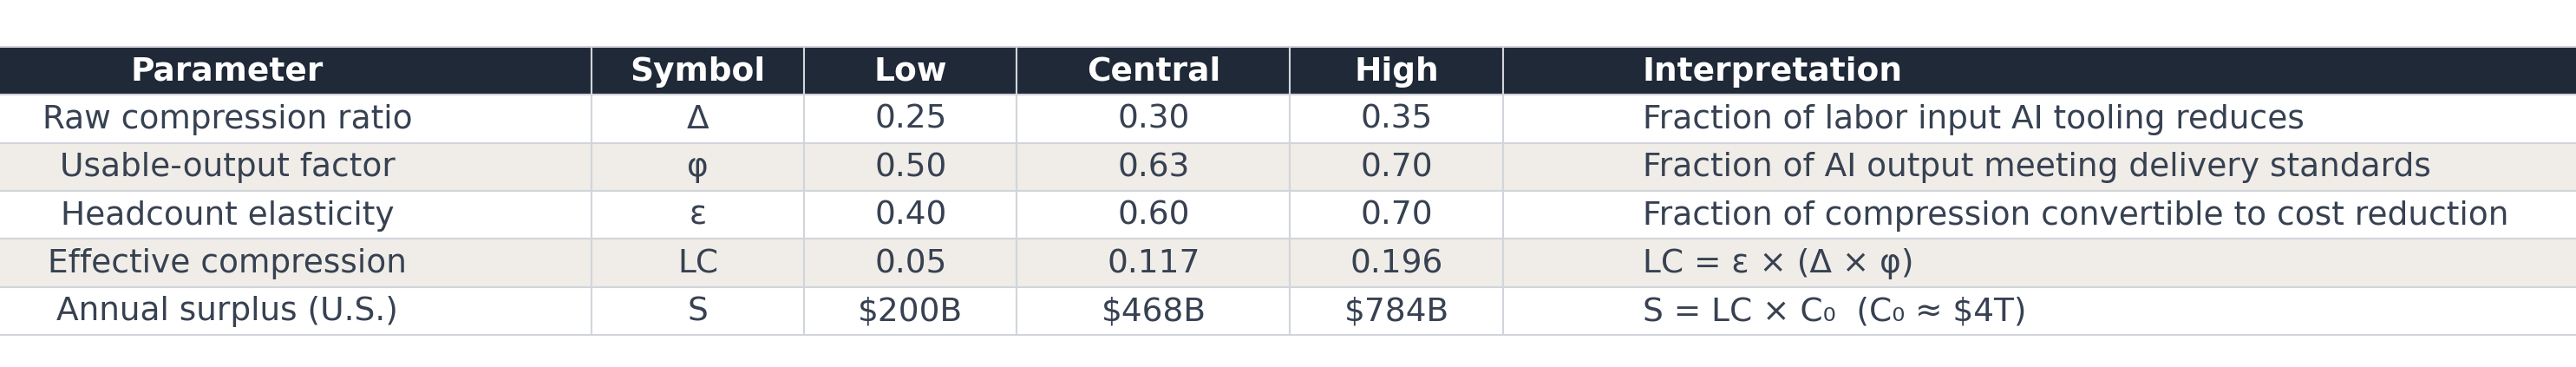
Raw compression ratios Δ in well-designed pilots are typically observed in the range of 0.25 to 0.35 — meaning that AI tooling reduces effective labor input for the targeted task bundle by 25 to 35 percent under close-to-optimal conditions. This range is consistent across multiple independent assessments of coding assistance, contract review, financial document analysis, and research synthesis, suggesting that a central estimate of approximately 30 percent is a reasonable baseline for Δ in high-applicability task bundles.
The usable-output factor φ is more variable and more dependent on implementation quality. In mature deployments with well-developed prompting architectures, output quality calibration, and integration into existing review workflows, φ is observed in the range of 0.6 to 0.7. In less mature deployments — where model outputs require substantial review and correction, or where integration friction is high — φ may fall to 0.5 or below. A central estimate of approximately 0.6 to 0.65 reflects the current state of enterprise deployment capability.
The headcount elasticity ε reflects organizational and contractual realities and varies considerably by sector. In flexible-staffing environments — consulting project teams, legal matters staffed on a case basis, software engineering squads — ε may approach 0.6 to 0.7 as headcount decisions are revisited on a project-by-project basis. In environments with high fixed employment costs, regulatory constraints on workforce adjustment, or strong organizational norms against rapid headcount changes, ε may fall to 0.4 to 0.5.
Substituting central estimates: LC = 0.60 × (0.30 × 0.65) ≈ 0.117, or roughly 12 percent effective compression in a typical early-deployment scenario. Under more favorable conditions — higher Δ from well-matched task bundles, φ approaching 0.70, ε at 0.65 — LC can reach approximately 0.20, or 20 percent effective compression. This range of 12 to 20 percent in early deployments is the empirically grounded anchor for near-term surplus modeling, with the expectation that Δ will rise as AI capability improves, φ will rise as organizational integration matures, and ε will rise as labor market adjustment mechanisms adapt.
What Intelligence Compression Reduces
The most structurally significant effect of intelligence compression is its impact on the leverage pyramid — the organizational model in which senior practitioners’ time and judgment are amplified through layers of subordinate labor performing structured analysis, document preparation, and preliminary synthesis. This model has been the productive core of professional services, investment banking, management consulting, and legal advisory for decades. Its economic logic depends on the assumption that junior labor is cheap relative to senior labor and that the ratio of junior-to-senior output is high enough to justify the pyramid structure.
AI compression attacks this assumption directly. When AI tooling can perform 30 percent or more of the structured analysis, drafting, and synthesis that occupies junior labor, the optimal pyramid ratio falls. The senior practitioner remains essential; the volume of junior labor required to support each senior practitioner does not. The immediate practical consequence is that revenue per senior FTE rises as the same deliverable requires less subordinate input. The strategic consequence is that firms organized primarily around the leverage pyramid face a structural challenge to their core economic mechanism, not a temporary headcount adjustment.
Intelligence compression also accelerates output. The same team, with AI tooling well integrated, produces more deliverables per unit of time. This output acceleration initially manifests as margin expansion for early adopters — more revenue per dollar of labor cost. The medium-term dynamic, however, is competitive price compression: as AI-native entrants calibrate their pricing to the lower cost structure that AI tooling enables, and as incumbent adoption catches up, the productivity surplus is competed away in the form of lower prices to clients rather than retained as profit. The firm that captures enduring surplus from intelligence compression is not the one that adopts AI earliest, but the one that uses the early adoption window to build organizational capabilities, client relationships, and service architectures that are not easily replicated.
Reinterpreting the Production Function
The standard treatment of productivity-enhancing technology in macroeconomic models is to increase total factor productivity A in a Cobb-Douglas or similar production function, leaving the factor substitutability between labor (L) and capital (K) unchanged. This treatment is inadequate for the present case, because AI does not merely make labor and capital jointly more productive; it alters the substitutability between them.
A more appropriate formulation recognizes that AI capital (K_AI) can substitute for a portion of human labor, producing an effective labor input:
L̃ = L(1 − Δ) + θ · K_AI
Here, L(1 − Δ) is the residual human labor input after AI compression, and θ represents the effectiveness with which AI capital substitutes for human labor in the task bundle — effectively the productivity of AI capital relative to the human labor it displaces. K_AI is the stock of AI capital deployed, encompassing model access, fine-tuned systems, agent infrastructure, and the organizational capital required to deploy these tools effectively.
The critical macroeconomic parameter in this formulation is the elasticity of substitution between human labor L and AI capital K_AI. If this elasticity exceeds unity — if AI capital and human labor are gross substitutes — then as AI capital becomes cheaper, labor’s share in production declines structurally, not merely cyclically. If the elasticity is below unity — if AI capital and human labor are gross complements — then falling AI costs raise the marginal product of human labor, and labor’s share may be maintained or increased even as the capital-to-labor ratio rises. The weight of current empirical evidence, though preliminary, leans toward substitutability exceeding complementarity for the task bundles most directly in AI’s current capability range — structured cognitive work, analysis, and synthesis. For tasks requiring embodied judgment, complex interpersonal interaction, and high-stakes irreversible decision-making, complementarity may dominate. The practical implication is that labor market impacts will be highly differentiated by task type, with substitution effects concentrated in the structured cognitive tier and complementarity effects concentrated at the highest level of judgment-intensive work.
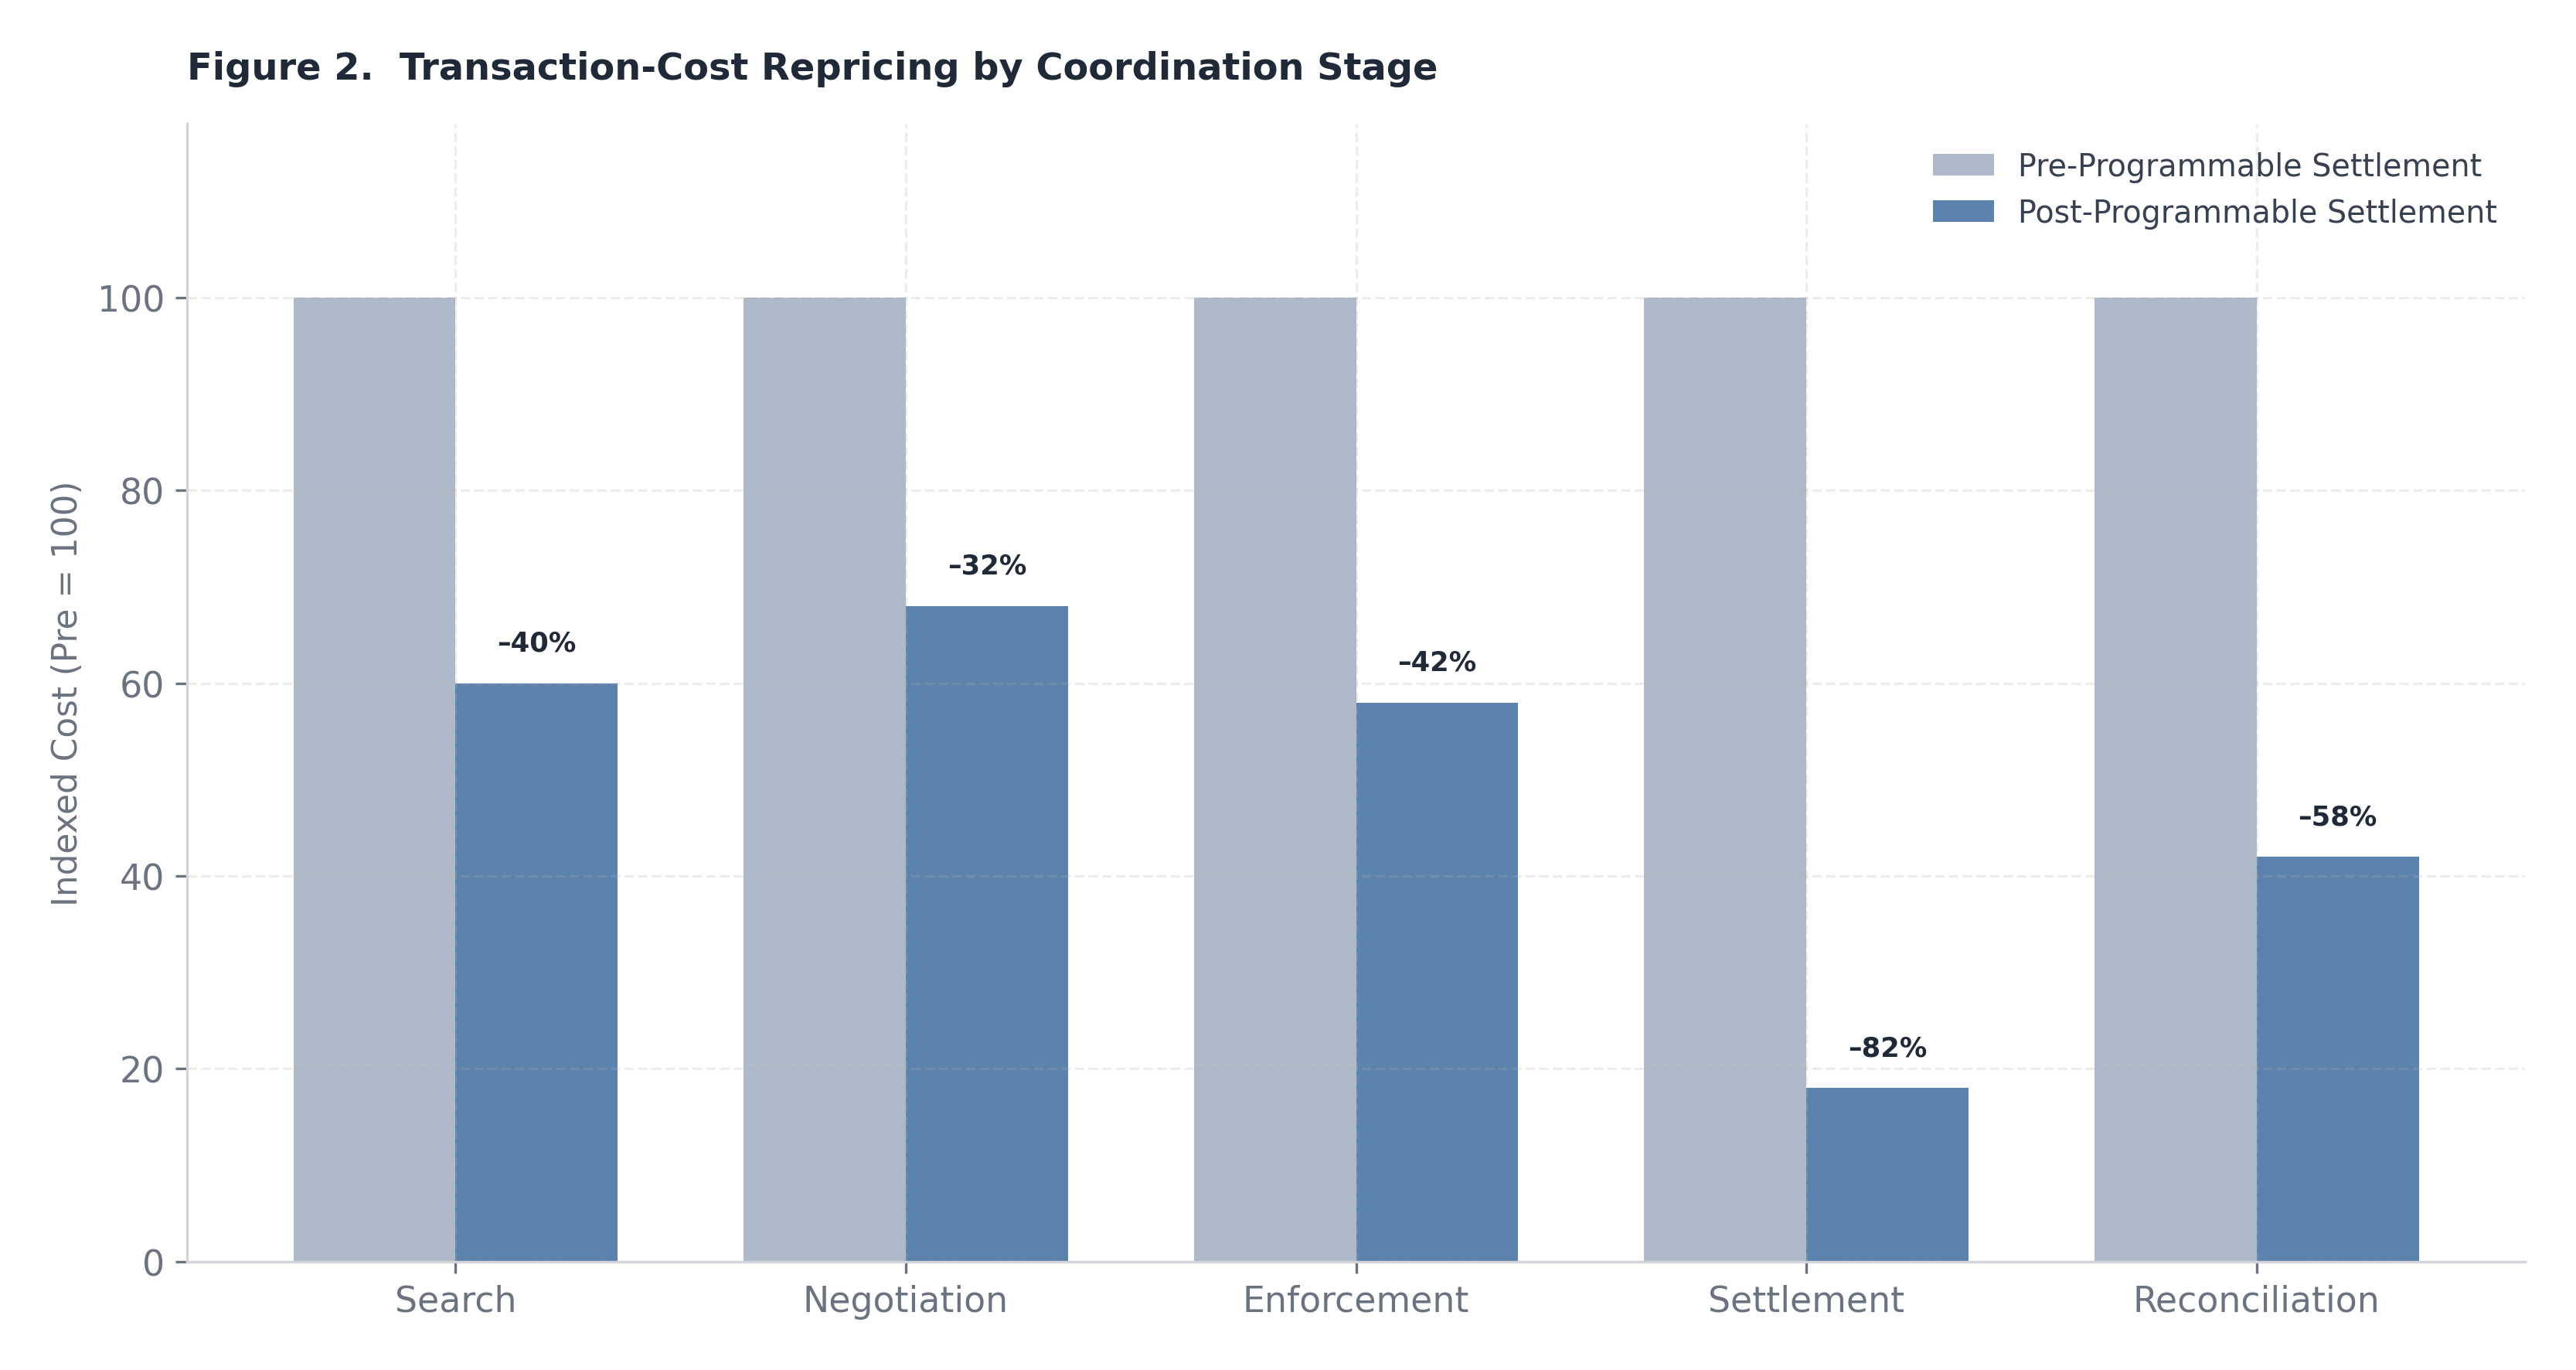
Figure 2. Indexed transaction-cost compression by stage, with pre-programmable settlement baseline normalized to 100.
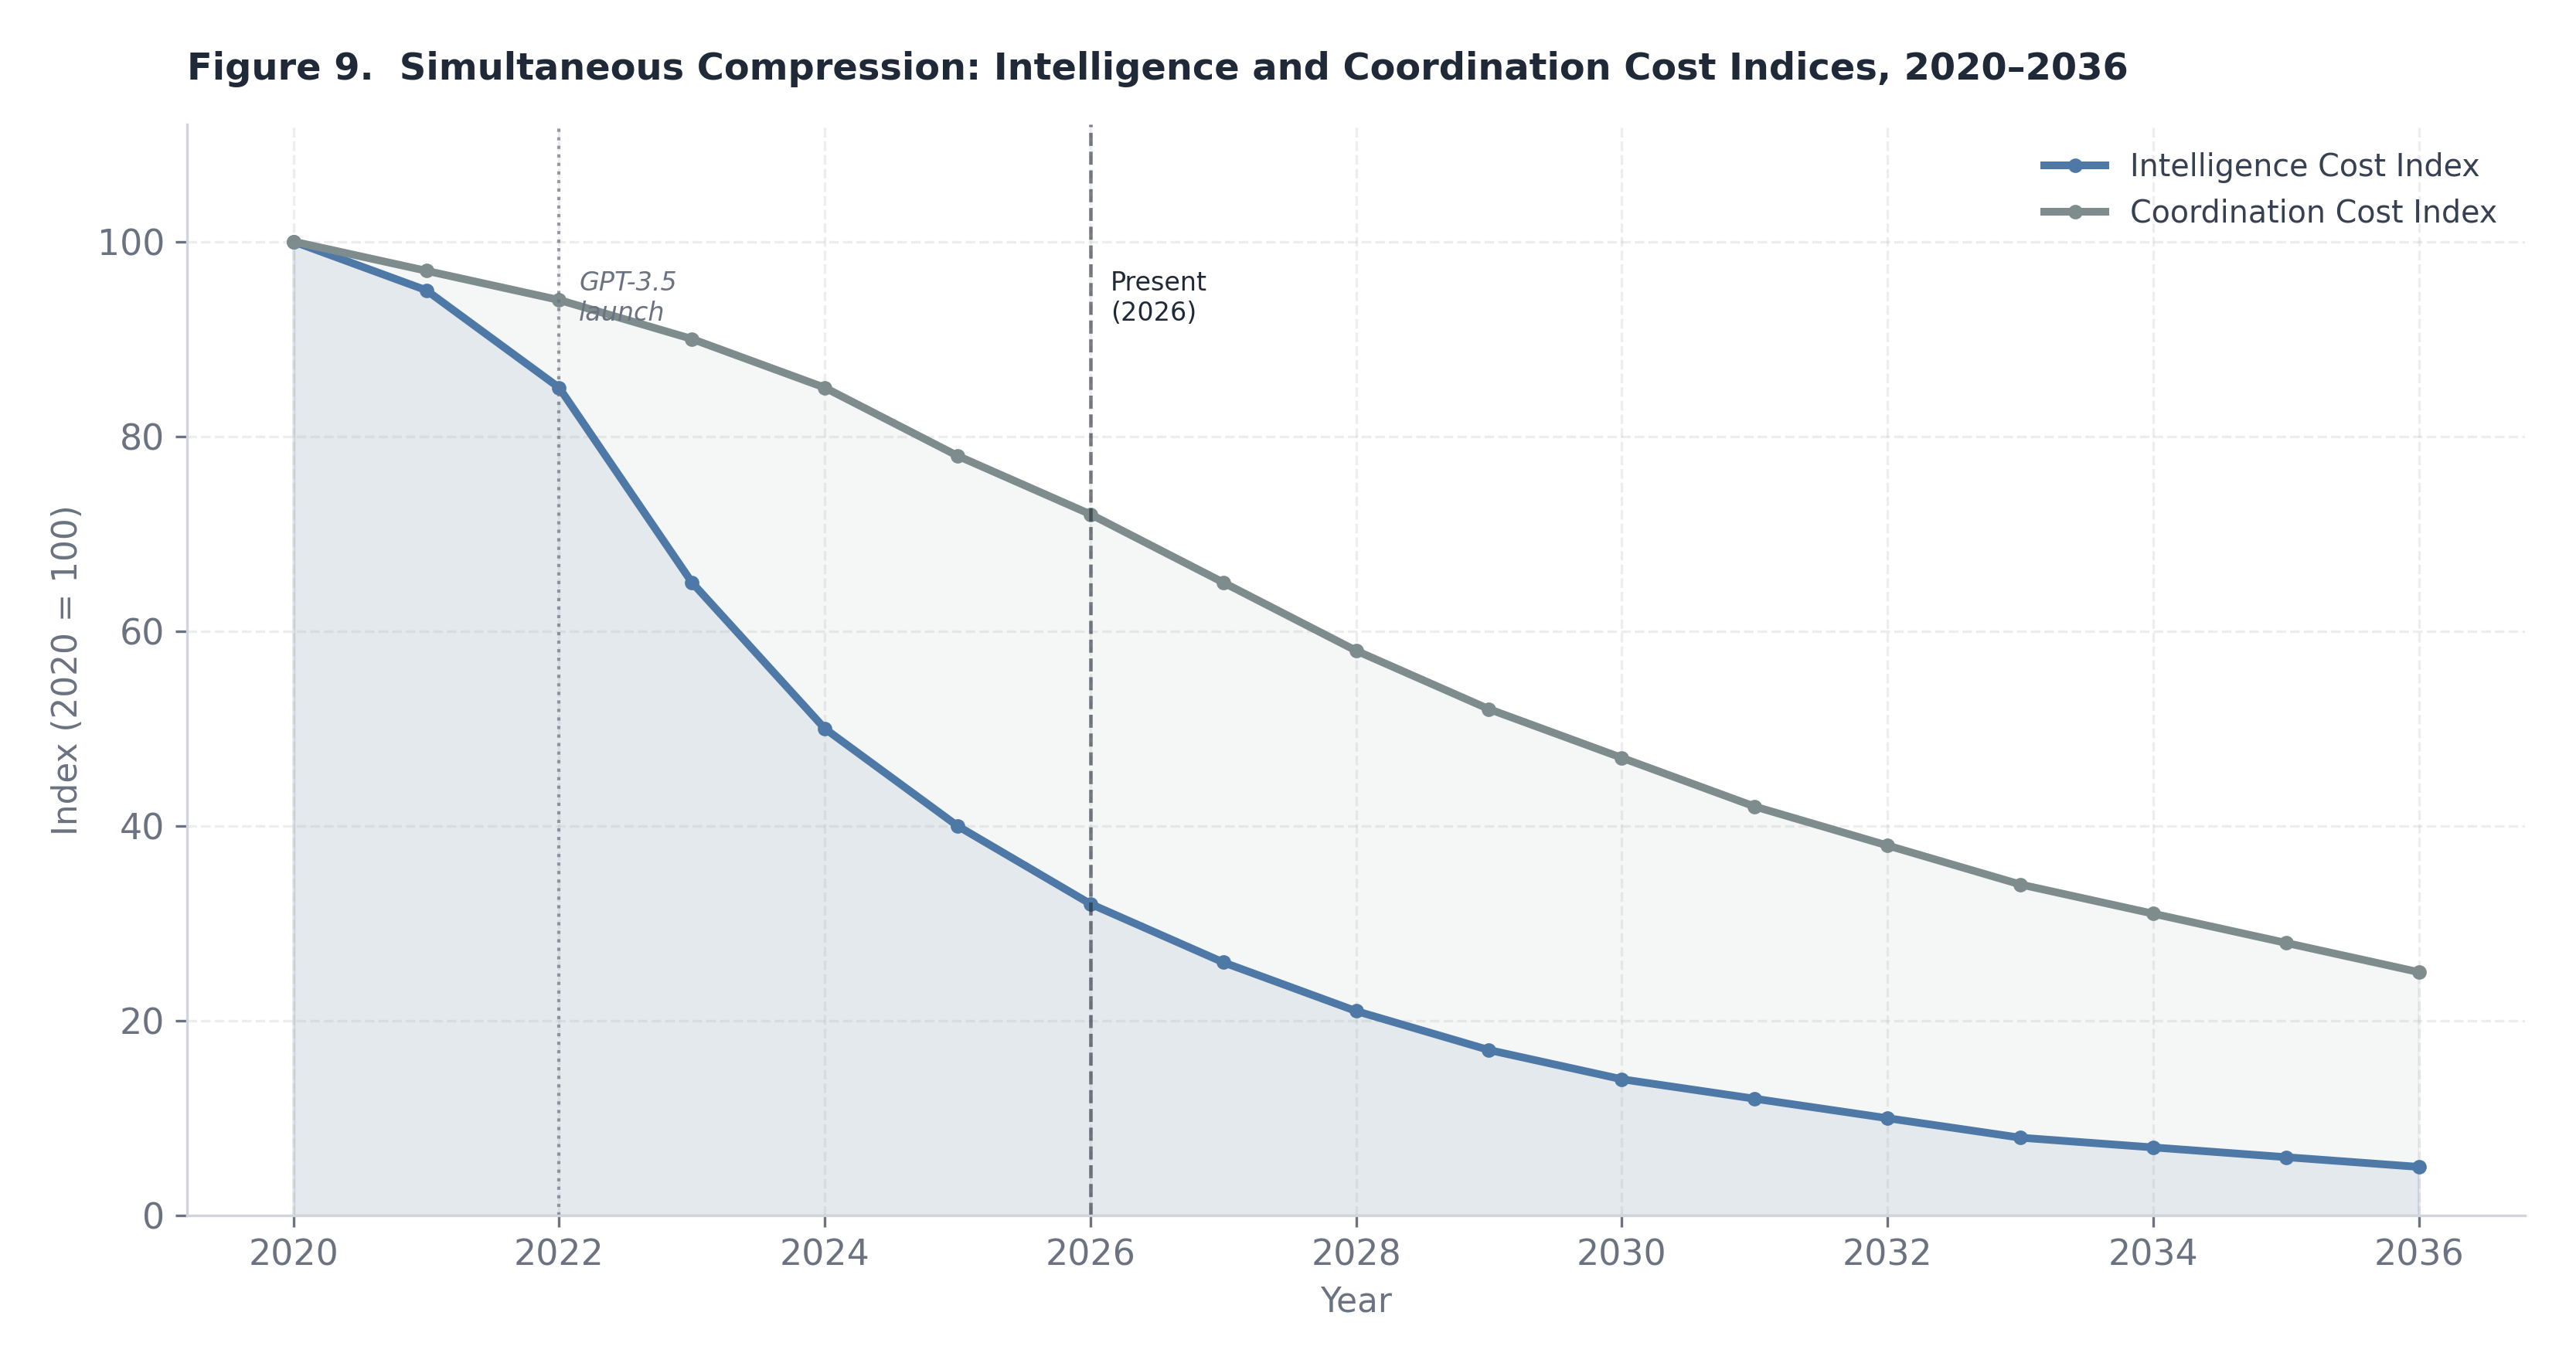
Figure 9. Both intelligence cost (AI-driven) and coordination cost (programmable settlement-driven) indices decline from a 2020 baseline of 100. Their simultaneous compression is the defining structural dynamic of the Convergence Economy.
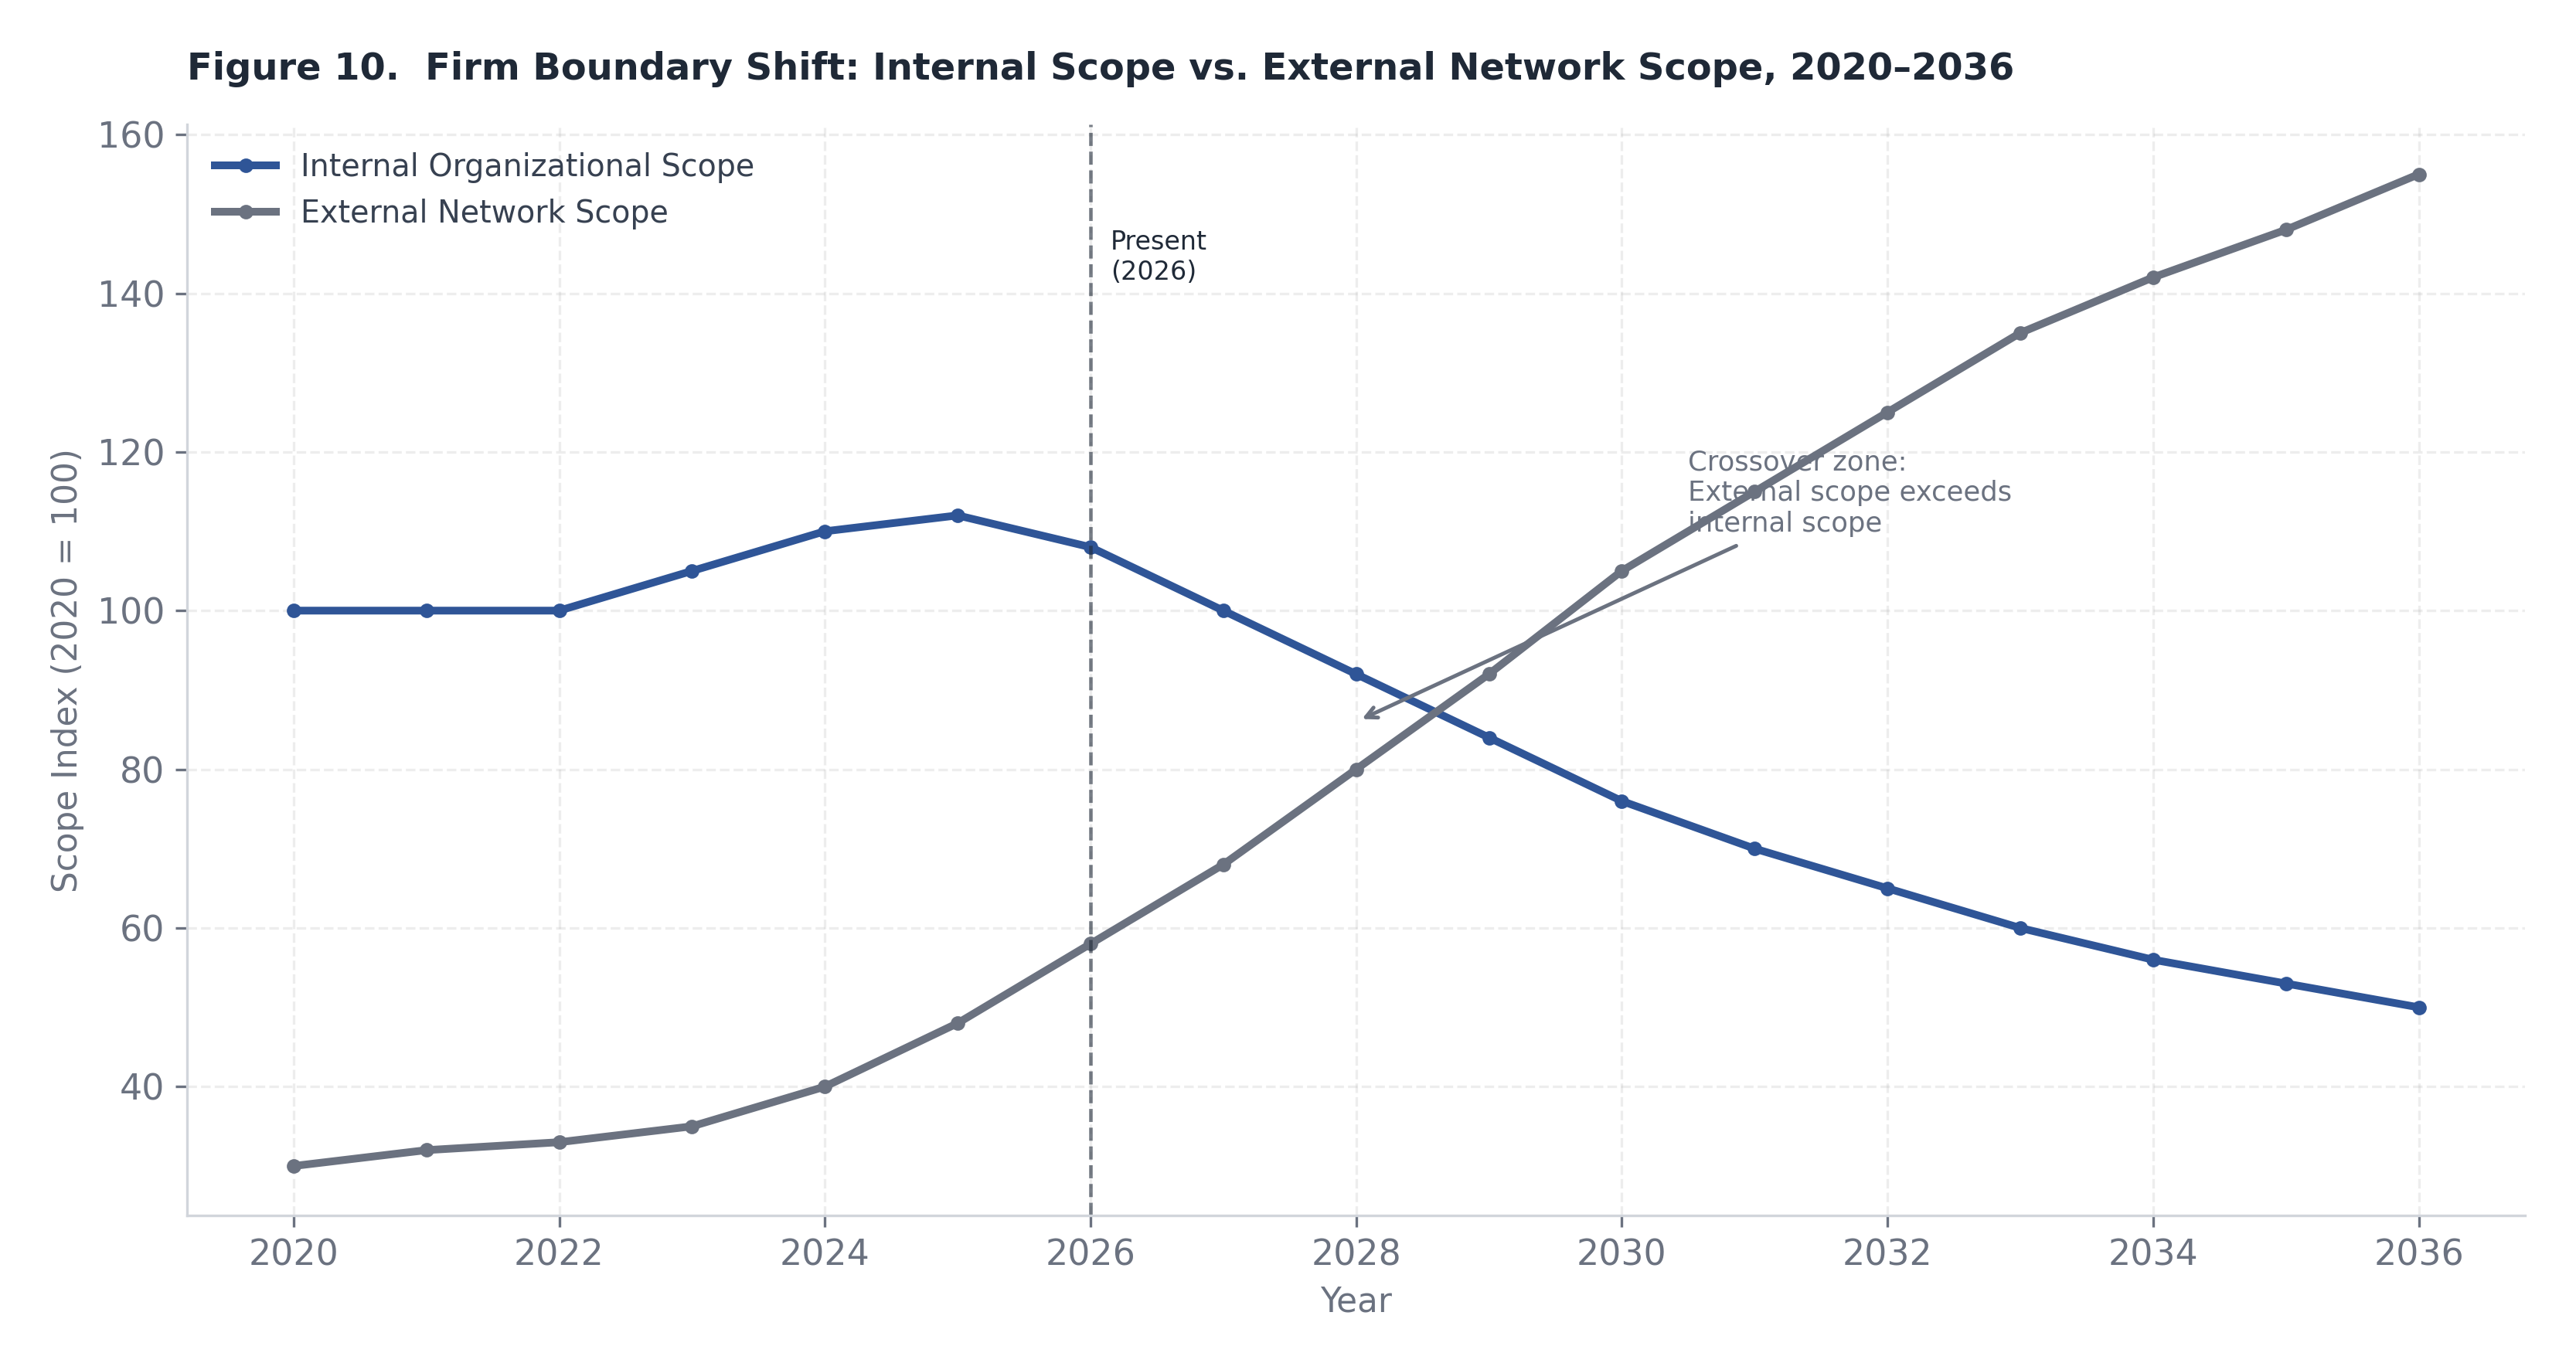
Figure 10. As dual compression proceeds, internal organizational scope peaks and declines while external network scope expands. The crossover marks the transition from hierarchical to orchestration-based firm architecture. Transaction costs are not a monolithic category. They are composed of distinct cost elements that arise at different stages of the coordination process, and each element is affected differently by the infrastructure changes now underway. A rigorous treatment of coordination compression requires disaggregating transaction costs into their constituent components, analyzing the magnitude of reduction achievable in each, and then assessing the aggregate effect on the firm boundary and the enterprise architecture.
The canonical taxonomy of transaction costs encompasses five stages: search (the cost of identifying suitable counterparties and assessing their capabilities and reliability); negotiation (the cost of reaching agreement on terms, conditions, and contingencies); enforcement (the cost of ensuring that contracted obligations are fulfilled); settlement (the cost of completing the financial transfer and achieving finality); and reconciliation (the cost of verifying, recording, and matching transaction records across the parties involved). In the pre-programmable-settlement environment, all five stages carry substantial friction, particularly for transactions that cross institutional, jurisdictional, or temporal boundaries.
Settlement Latency and Counterparty Exposure
The most directly quantifiable reduction from programmable settlement is in settlement latency. Conventional cross-institutional financial settlement — whether for contractor payments, intercompany transfers, supply chain disbursements, or royalty flows — operates on cycles ranging from one to five business days in most major markets, with cross-border transactions potentially extending further. This latency creates a counterparty exposure window during which one or both parties bear risk of default, operational failure, or dispute without recourse to finality. For large transactions, this exposure is typically managed through credit facilities, collateral requirements, and correspondent banking relationships — all of which carry costs that are embedded in the effective transaction price.
Programmable settlement on blockchain or distributed ledger infrastructure collapses this latency to near-zero for a growing class of transactions. The settlement of stablecoin transfers, tokenized payment obligations, and smart-contract-triggered disbursements can achieve finality in seconds rather than days. The practical consequence is not merely speed; it is the elimination of the counterparty exposure window and the associated credit risk management overhead. For enterprises that process large volumes of relatively standardized payments — contractor disbursements, milestone-based professional service payments, revenue shares — the reduction in working capital lockup, credit facility utilization, and administrative management costs is meaningful and recurring.
Conditional Execution and Milestone-Based Contracting
Beyond settlement speed, programmable settlement enables conditional execution — the automatic release of payment contingent on the verification of specified conditions, without the need for human intervention at the trigger point. This is particularly consequential for the coordination of distributed micro-enterprise networks, where the cost of manually verifying, approving, and processing a large volume of small payments represents a significant administrative overhead relative to payment size. In a traditional contracting model, this overhead creates an effective minimum transaction size below which outsourcing is administratively unviable. Programmable settlement removes this minimum, enabling the economic viability of micro-payments — payments for discrete, verifiable outputs of small unit value — at scale.
The architectural implication is that production networks can be structured around granular milestone verification rather than bulk periodic settlement. A research task completed, a document reviewed, a module tested, a translation verified — each discrete output can trigger an immediate conditional payment without requiring human approval at the individual transaction level. This shifts the locus of coordination cost from transaction processing to the design of verification conditions, which is a one-time fixed cost rather than a per-transaction variable cost. The amortization of this fixed cost across large volumes of transactions is what makes programmable settlement economically transformative for distributed production architectures.
Treasury and Working Capital Architecture
At the enterprise treasury level, programmable settlement creates both opportunities and new requirements. The reduction in float — the time during which payment is in transit and neither party has full access to the funds — reduces the working capital required to sustain ongoing operations at a given revenue level. Enterprises that currently maintain substantial cash buffers to manage payment timing mismatches can redeploy a portion of this capital to productive uses. In aggregate, across a large enterprise with complex payment flows, the reduction in working capital lockup from near-zero settlement latency can be material relative to the cost of capital.
However, real-time settlement also creates new requirements for liquidity management precision. In a T+2 or T+3 settlement environment, treasury functions manage liquidity at a daily or weekly level with substantial buffer capacity. In a real-time settlement environment, liquidity must be available at the point of transaction with greater precision, requiring more sophisticated cash positioning, automated liquidity sweeps, and real-time visibility into payment obligations and incoming receipts. This represents a net increase in treasury complexity even as it reduces working capital cost — a transition that requires investment in treasury technology infrastructure before the cost benefits are fully realized.
The emergence of multi-rail settlement environments — in which enterprises operate across conventional banking rails, domestic faster-payment systems, and blockchain-based stablecoin rails simultaneously — introduces redundancy requirements and reconciliation complexity. On-chain reconciliation tools that can match transaction records across rails in real time are becoming a necessary component of enterprise treasury infrastructure, representing both a cost and a capability investment.
Reconsidering the Firm Boundary
The combination of AI-enabled output normalization and programmable settlement cost reduction requires a systematic revision of the make-versus-buy analysis that underlies firm boundary decisions. The classical Coasian condition for internalization is:
Internalize when TC_market > TC_internal
As noted in Section 2, AI reduces TC_internal for many knowledge-intensive activities by lowering the effective cost of complex task completion. Simultaneously, programmable settlement reduces TC_market — the cost of contracting for external production — by lowering search, negotiation, enforcement, settlement, and reconciliation overhead.
The critical insight is that these two forces affect the two sides of the Coasian inequality asymmetrically across activity types. For the strategic core of an enterprise — activities involving proprietary judgment, irreplaceable institutional relationships, regulatory accountability, and genuine asset specificity — TC_internal falls modestly (AI accelerates delivery but does not alter the fundamental rationale for internalization), while TC_market may remain high (external contracting is infeasible or undesirable regardless of settlement costs). These activities remain internal.
For standardized, verifiable, output-definable activities that were previously internalized primarily because TC_market was prohibitively high — structured analysis, document production, code review, compliance monitoring, data processing — both TC_internal falls (AI reduces internal production cost) and TC_market falls (programmable settlement reduces external coordination cost). In this category, the optimal boundary becomes genuinely ambiguous and increasingly shifts toward selective externalization to AI-enabled micro-operators or specialized micro-enterprises.
This can be expressed formally as a condition on the optimal firm size S*, which is now a function of three variables: the AI substitution capacity across the activity bundle (which reduces required internal headcount), the transaction cost compression factor (which reduces TC_market for externalized activities), and the residual trust cost τ. Trust cost — the risk premium associated with contracting sensitive work to external parties where reputational, IP, or relationship risks are non-trivial — may remain substantial even as mechanical transaction costs approach zero. The observation that TC_market approaches a near-zero bound in some activity categories does not imply that optimal firm size converges to an extreme; trust costs, regulatory accountability, and the ongoing value of organizational culture and institutional memory act as meaningful countervailing forces.
International and Cross-Border Implications
The reduction in cross-border coordination costs has implications that extend beyond the domestic firm boundary into the geography of labor markets and global production networks. Stablecoin-based settlement enables real-time payment to contractors in any jurisdiction with network access, at near-zero transaction cost and without the currency conversion friction and correspondent banking overhead that has historically made micro-transactions across borders economically unviable. This fundamentally changes the feasibility calculus for global micro-enterprise networks.
The geographic wage arbitrage dynamic — the cost advantage of engaging high-skill labor in lower-wage markets — has existed since the early internet era but has been constrained by coordination friction, payment overhead, quality variability, and the minimum viable engagement size imposed by transaction costs. Programmable settlement reduces these constraints substantially, enabling the economic viability of smaller-scale, shorter-duration, cross-border engagements. The implication is that geographic wage arbitrage will accelerate as a production strategy in sectors where AI-normalized output quality removes the quality-verification barrier to cross-border engagement.
There is, however, a partial countervailing dynamic. AI tooling raises the productivity of practitioners in lower-wage markets, potentially enabling them to compete on output quality as well as price. As AI-enabled practitioners in emerging markets achieve output quality approaching that of high-cost-market incumbents, the wage differential sustaining arbitrage narrows — not because wages in high-cost markets fall, but because the productivity differential that justified paying them erodes. In the longer run, AI tooling may contribute to a productivity equalization that partially offsets the acceleration of geographic wage arbitrage, though the transition period is likely to be characterized by significant wage pressure in mid-tier knowledge work roles in high-cost markets before this equilibrium is approached.
The aggregate effect on the global distribution of knowledge-work income is therefore ambiguous at the margin, though its direction for high-cost-market junior-tier knowledge workers is directionally negative. The combination of programmable settlement removing coordination barriers and AI tooling removing quality-verification barriers to global micro-enterprise engagement represents a structural shift in the competitive environment for structured cognitive labor, one that will reward practitioners who build judgment-intensive capabilities while placing sustained pressure on those whose value proposition rests primarily on task execution.
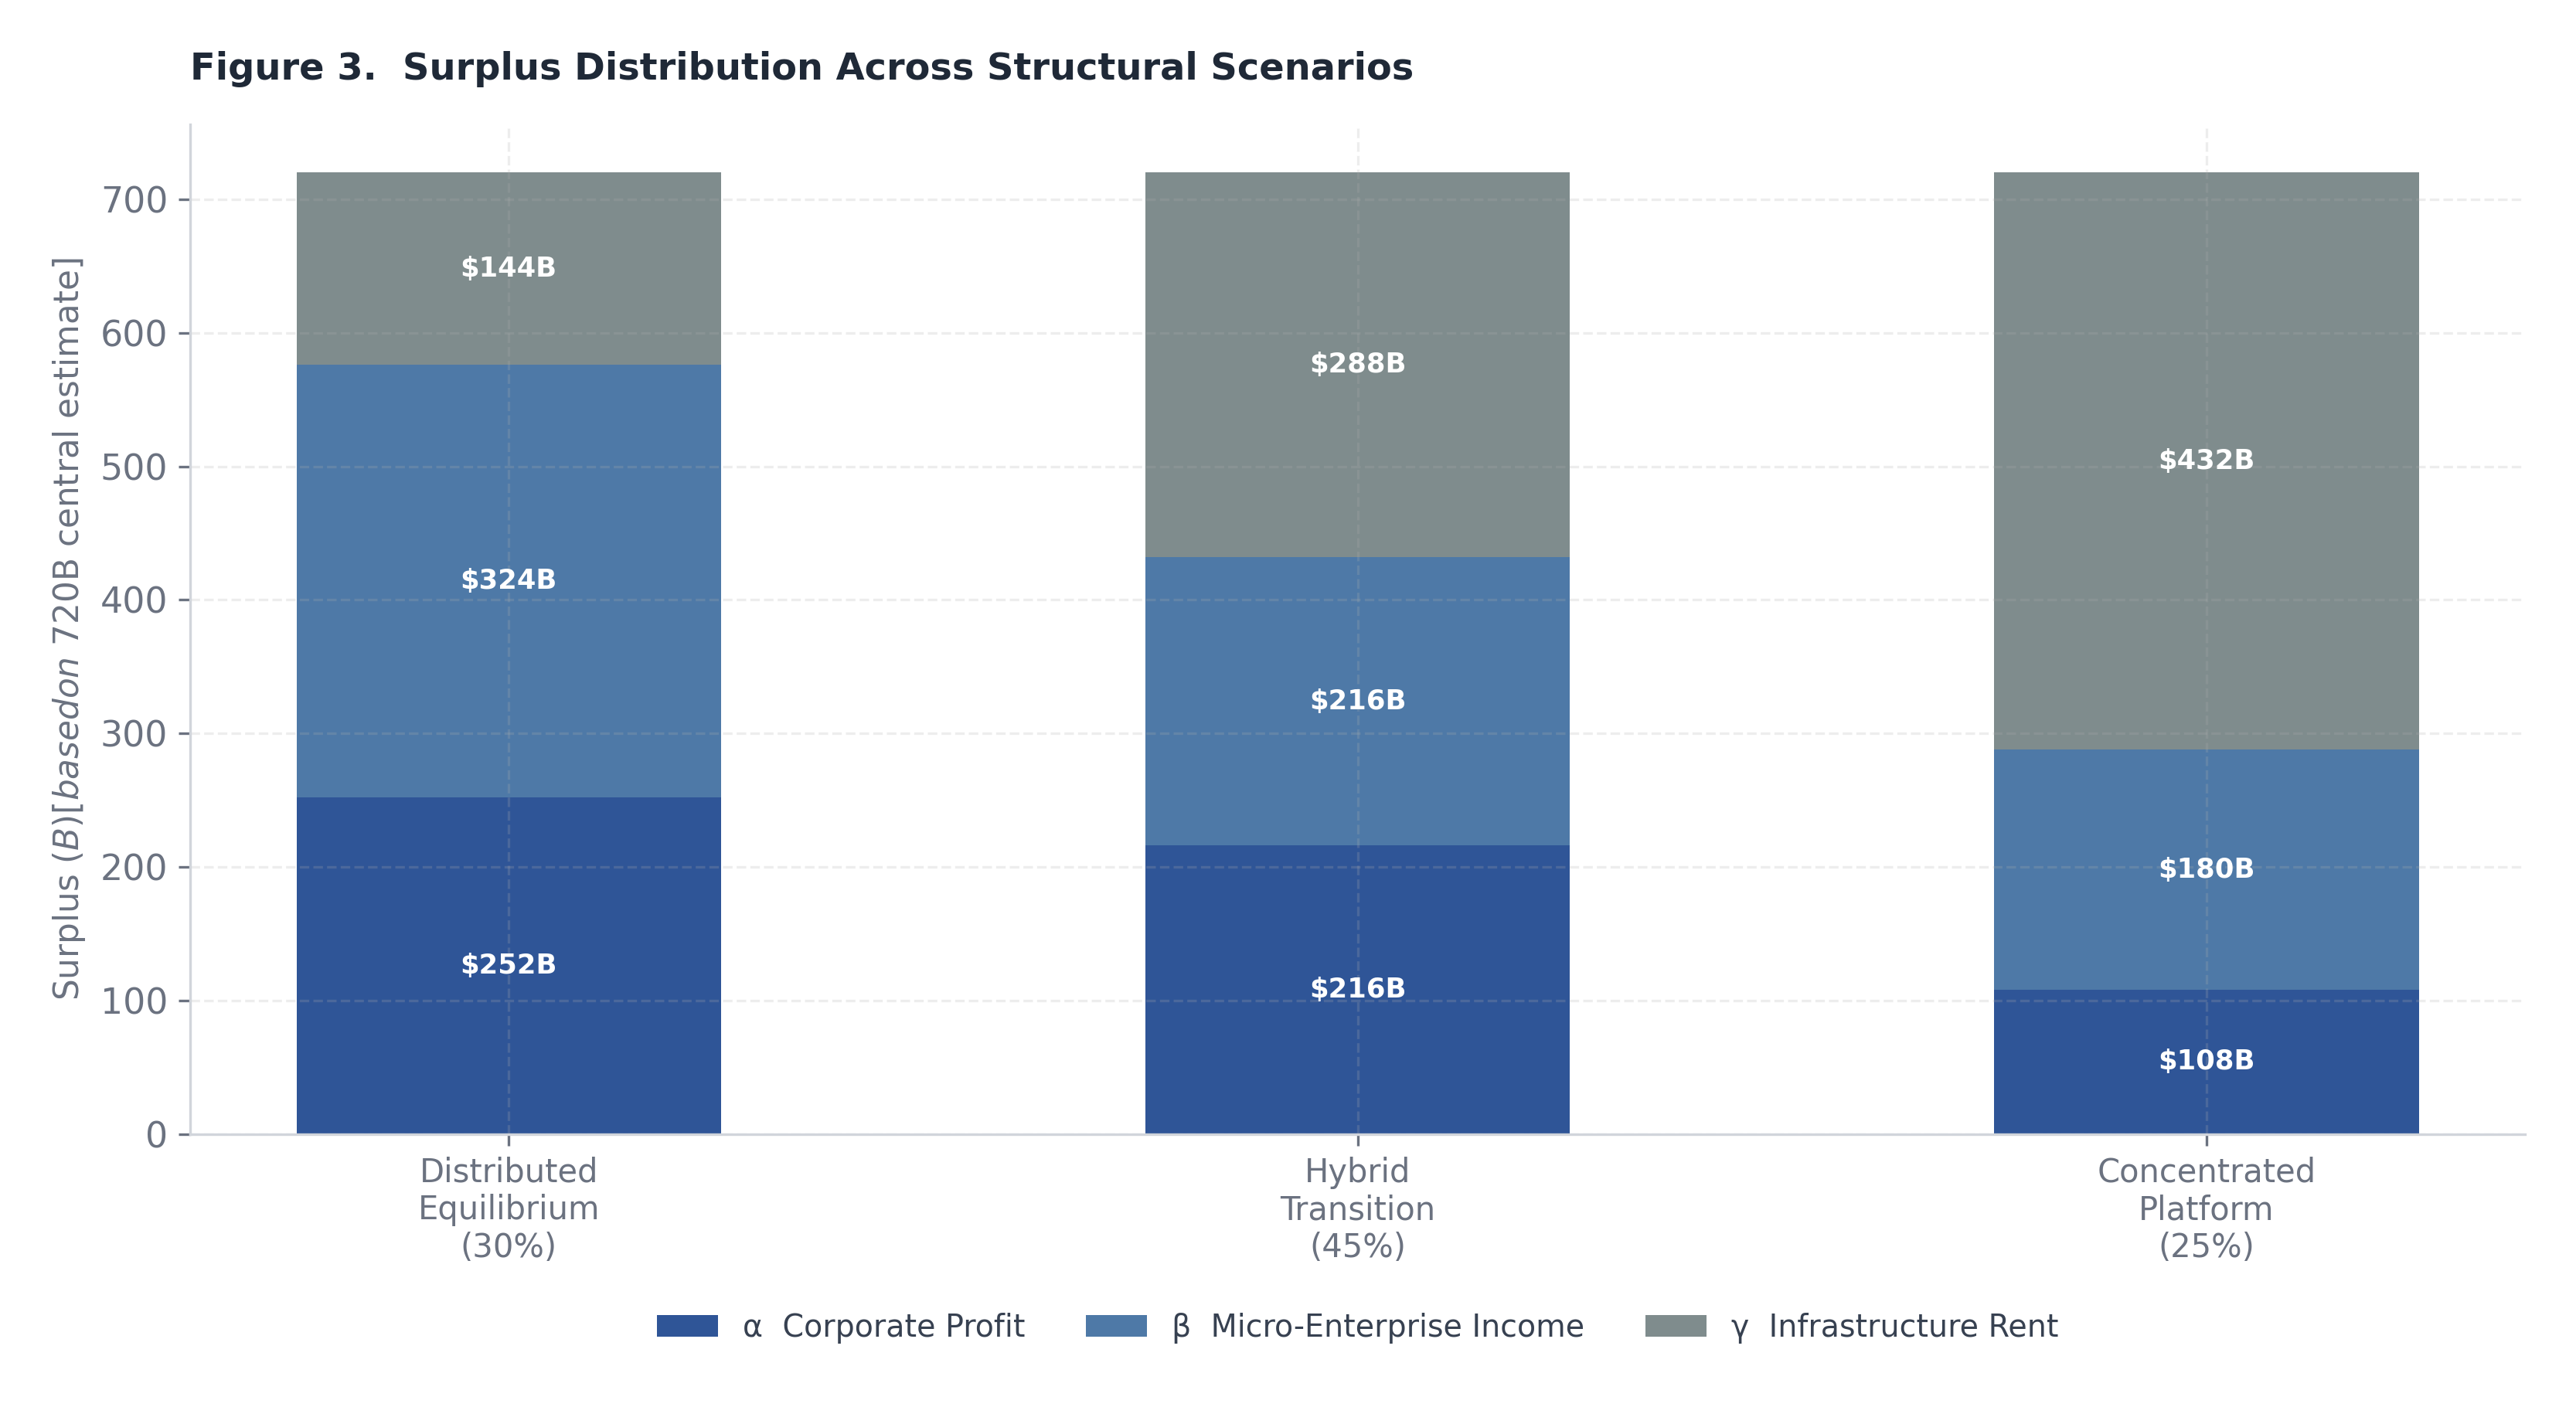
Figure 3. Dollar-value allocations of annual U.S. knowledge-economy surplus across corporate profit (α), micro-enterprise income (β), and infrastructure rent (γ) under three scenarios (based on ~$720B central estimate).

Table 2. Comparison of the three structural scenarios with probability weights, distribution coefficients (α/β/γ), dollar amounts, labor-share ranges, and probability-weighted expected outcomes.
Any serious attempt to assess the macroeconomic consequences of AI-mediated labor compression must begin with a tractable model of surplus formation — that is, the economic value created when a unit of cognitive labor is displaced or augmented at below-replacement cost. The aggregate surplus generated across the knowledge economy can be expressed through a compact identity:
S = LC × C0
where S denotes the total annual surplus (measured in nominal dollars), C₀ represents the addressable knowledge-sector wage base, and LC is the labor compression coefficient — the fraction of that wage base that is effectively replaced or structurally augmented by AI-mediated processes over the relevant measurement horizon.
Calibrating against the U.S. knowledge economy, C₀ can be estimated at approximately $4 trillion annually, reflecting aggregate compensation across the broad professional, technical, managerial, and information-services workforce. This figure encompasses the wage mass of workers whose primary output is cognitive — analysis, synthesis, communication, decision support, documentation — rather than physical. Using a central-case labor compression coefficient of LC ≈ 18%, the aggregate surplus identity yields S ≈ $720 billion per annum. This is not a realized windfall waiting to be claimed; it is, rather, a structural displacement potential — an upper bound on the value at stake as firms, independent operators, and infrastructure platforms make competing claims on the efficiency gains embedded in generative AI deployment.
The compression coefficient LC is itself a derived quantity. It can be decomposed as a function of two underlying parameters:
LC = f(ε, Δ)
where ε is the task-level elasticity of AI substitution (the degree to which AI-generated output can functionally substitute for human-generated output within a given task category), and Δ is the adoption depth parameter (the fraction of addressable cognitive tasks within C₀ that are actually exposed to AI mediation within the horizon). The two parameters interact multiplicatively: high substitutability has limited surplus impact if adoption depth remains shallow, and vice versa.
Under a high-case parameterization — ε = 0.8 and Δ = 0.35 — the implied compression coefficient rises to approximately LC ≈ 28%, yielding S ≈ $1.1 trillion. This scenario reflects a world in which enterprise adoption accelerates beyond current rates, regulatory friction remains manageable, and frontier model capability continues to expand into previously hard-to-automate task categories. Under a low-case parameterization — ε = 0.5 and Δ = 0.20 — the coefficient falls to LC ≈ 10%, with S ≈ $400 billion. This scenario reflects slower institutional adoption, persistent quality gaps in AI output for high-stakes professional tasks, and organizational resistance to restructuring. The central case at $720 billion represents a considered midpoint, but the $700 billion range between the high and low cases underscores the profound sensitivity of distributional outcomes to parameters that remain genuinely uncertain.
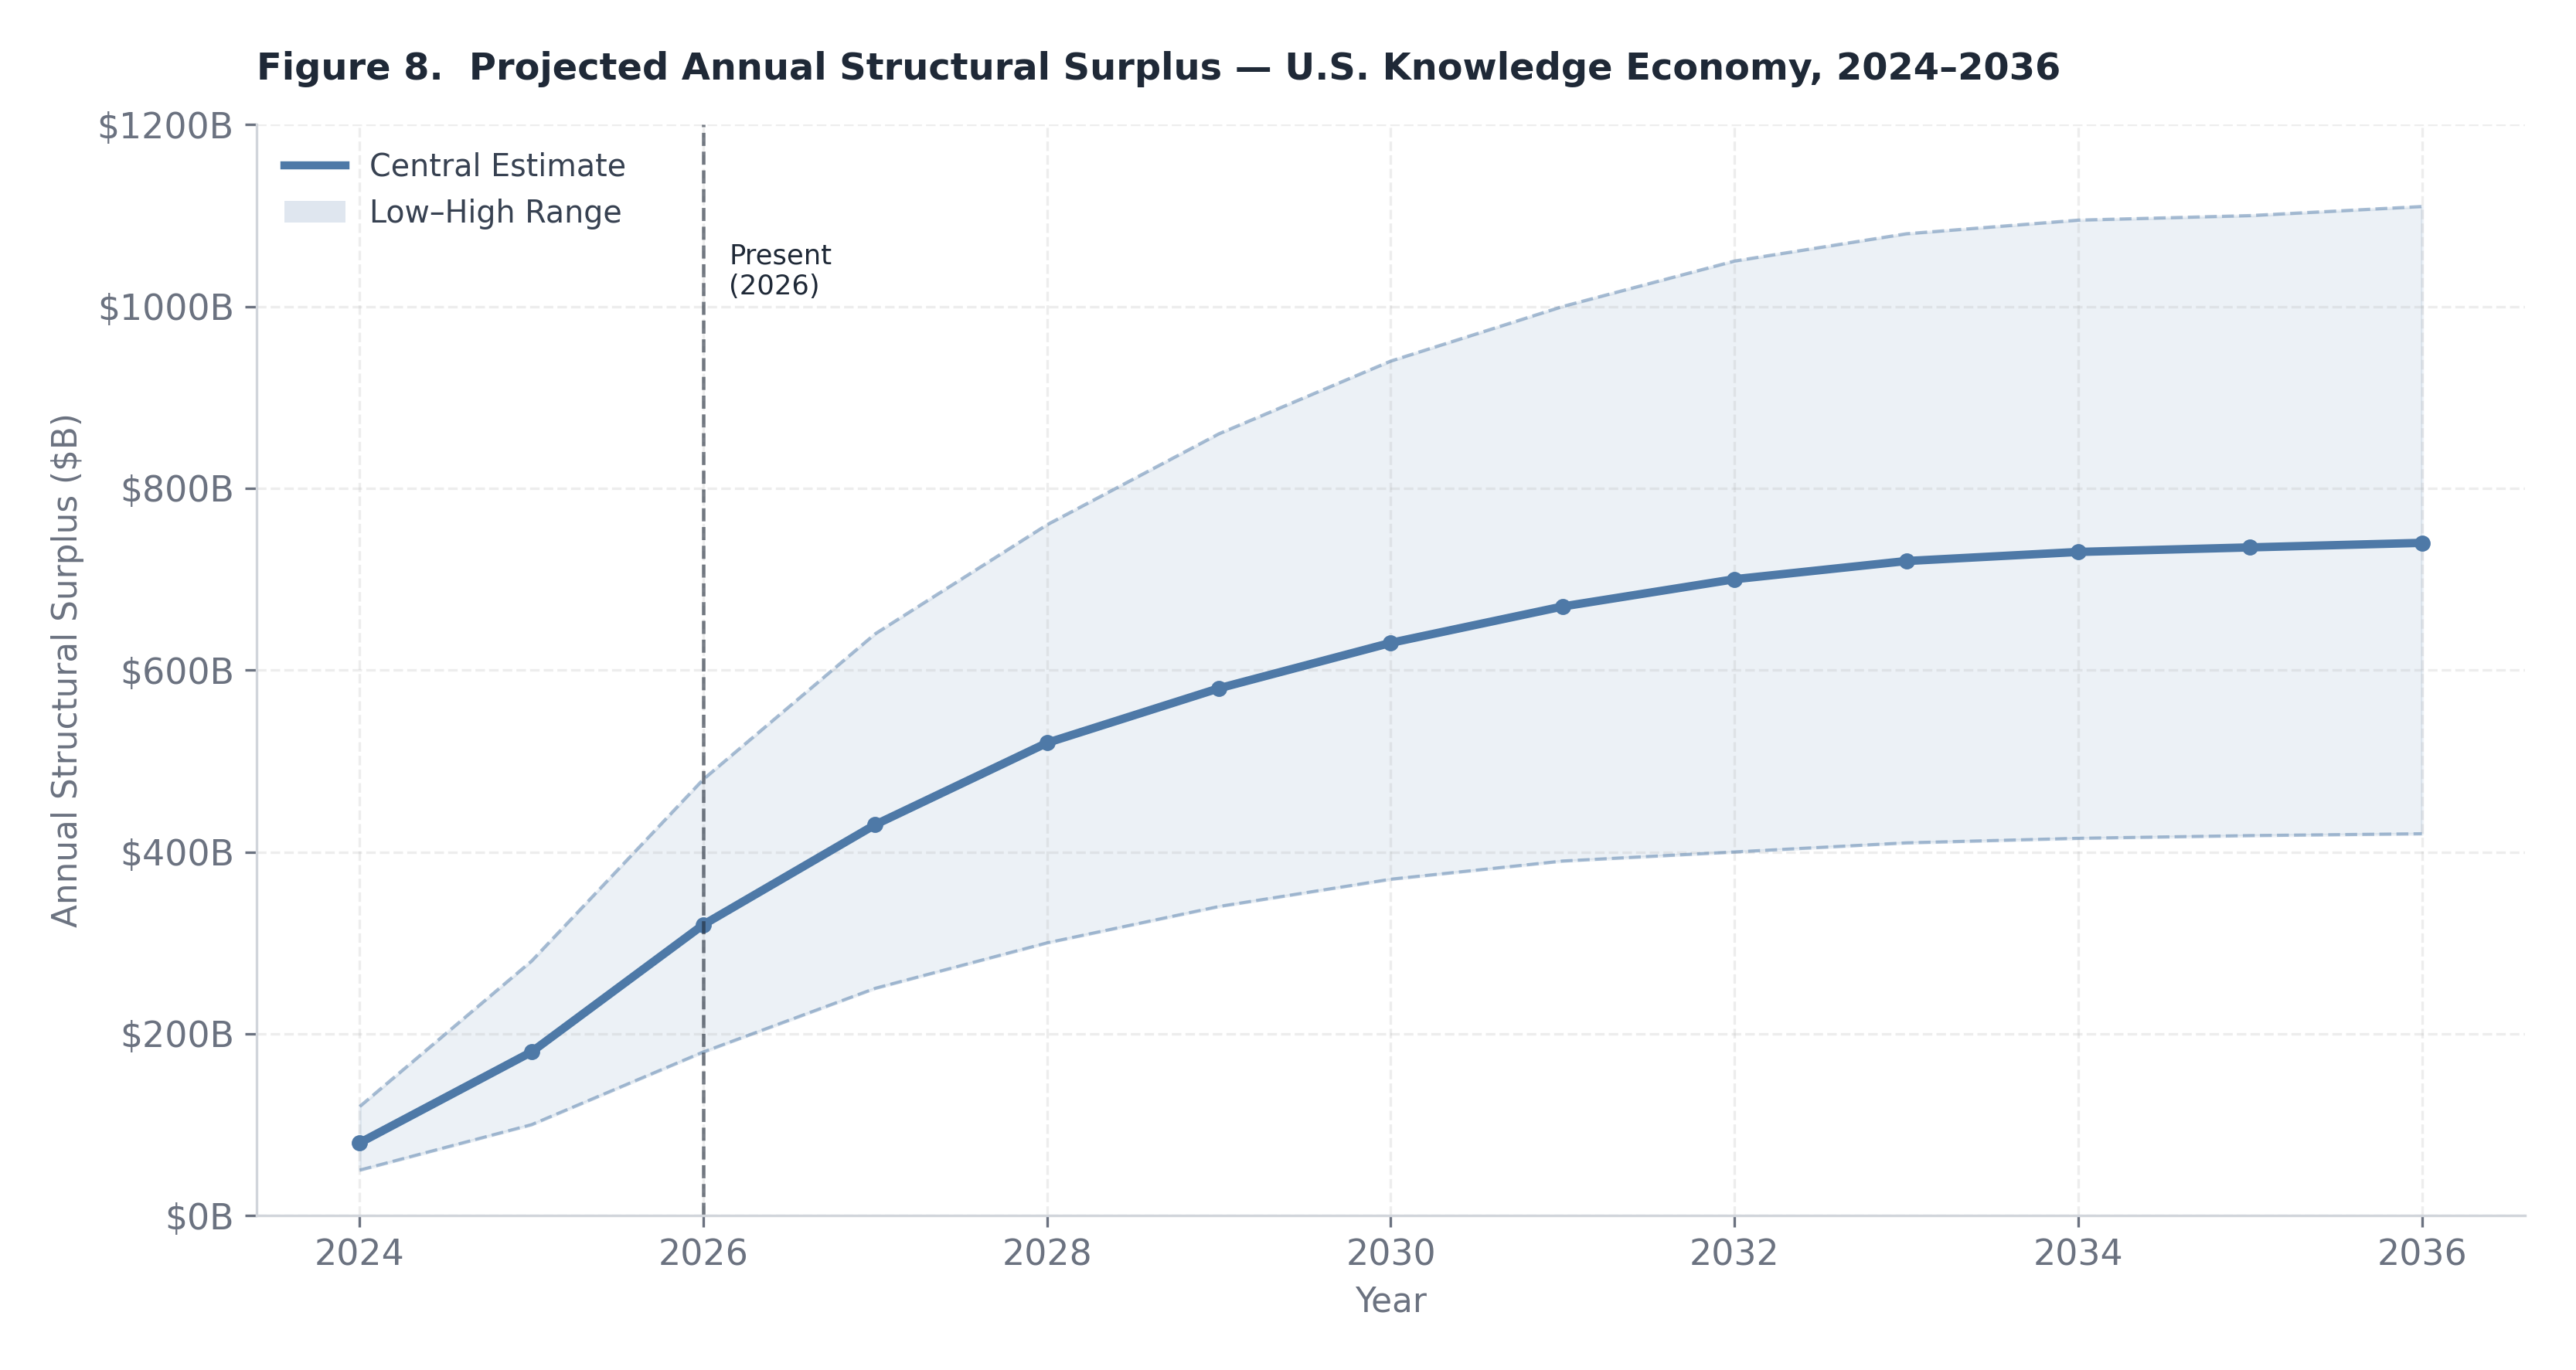
Figure 8. Central estimate (teal) with low–high range band (shaded). The surplus is projected to exceed $700B annually by 2032 under the central scenario. Exact data from the modelling in Section 5.1.
Surplus formation is only the first-order question. The more consequential question — with direct implications for income distribution, labor share dynamics, and political economy — is who captures the surplus once formed. Three distribution coefficients govern this allocation:
By construction, α + β + γ = 1. The three coefficients are not independent: the concentration of the AI infrastructure market, the design of procurement channels, the degree of open-model diffusion, and the architecture of regulatory oversight all systematically push the equilibrium toward different distributions. Three illustrative scenarios anchor the policy-analytic space.
Scenario 1 — Balanced Capture (α = 0.40, β = 0.30, γ = 0.30): In this scenario, no single agent class dominates the distribution. Corporate earnings grow modestly, independent operators find real but bounded income expansion, and infrastructure providers capture a significant but not overwhelming rent. Against the central-case surplus of $720 billion, this implies approximately $288 billion accruing to corporate earnings, $216 billion to micro-enterprise income, and $216 billion to platform infrastructure rent. This distribution is relatively benign from a labor share perspective: the micro-enterprise channel converts displaced wage income into self-employment income, preserving a meaningful share within the household sector. Political economy pressure is moderate, as the gains are sufficiently dispersed to limit concentrated backlash.
Scenario 2 — Infrastructure-Dominant Capture (α = 0.25, β = 0.15, γ = 0.60): This scenario describes a world in which a small number of compute and model platforms extract the dominant share of the surplus through pricing power, API monopoly, and network-effect moats. At $720 billion in total surplus, infrastructure providers capture approximately $432 billion — a remarkable concentration in an industry measured in dozens of material participants. Corporate profits are modest because firms face high AI input costs, and micro-enterprise formation is dampened because the economics of operating on top of expensive proprietary infrastructure are thin. This scenario most directly mirrors the historical pattern of industrial platform consolidation and is, arguably, the default trajectory absent deliberate countervailing policy. Its political economy consequences are severe: labor share declines, household income concentration rises, and the fiscal base erodes as infrastructure rents accumulate in entities with sophisticated tax optimization capacity.
Scenario 3 — Distributed AI Equilibrium (α = 0.35, β = 0.45, γ = 0.20): This is the most transformative distributional outcome. Independent operators and AI-augmented solo practitioners capture the largest single share — approximately $324 billion — while corporate incumbents retain a meaningful but not dominant portion and infrastructure rent is compressed by open-model diffusion and competitive supply. This scenario requires the proliferation of low-cost, high-quality open-source or open-weight foundation models, accessible fine-tuning infrastructure, and mature tooling ecosystems that allow individual operators to reach professional output quality at near-zero marginal cost. It also requires robust demand for micro-enterprise output, whether through consumer markets, enterprise procurement platforms that disaggregate vendor relationships, or new forms of project-based contracting. Labor share does not decline under this scenario; indeed, by converting displaced wage workers into independent income earners, the macro distribution may actually improve relative to the pre-AI baseline.
The three distribution coefficients are not exogenously fixed; they are endogenous to the institutional architecture of the AI economy. Four structural determinants are analytically primary. Infrastructure concentration is perhaps the most important: when compute and model access are controlled by a small number of vertically integrated providers, γ rises mechanically, compressing both α and β. Procurement design — specifically, whether large enterprises purchase AI output from integrated vendors or through competitive micro-procurement markets that expose independent operators — is the second determinant. Open-model diffusion, accelerated by the release of competitive open-weight models, is the third: as the frontier capability gap between proprietary and open models narrows, infrastructure rents are disciplined and β rises. Regulatory architecture — particularly around data access, interoperability mandates, and API governance — shapes the underlying competitive dynamics that determine all three coefficients simultaneously.
There is historical precedent for a significant lag between demonstrated technological capability and measurable macroeconomic productivity growth. The original Solow paradox — the observation that computers were “everywhere except in the productivity statistics” — persisted for well over a decade before the 1990s acceleration. Several structural mechanisms create an analogous risk for the current AI transition. First, if the surplus is captured primarily as corporate margin expansion rather than output expansion, measured GDP growth does not necessarily accelerate proportionally: the same nominal output is produced at lower cost, improving profitability without adding value to the national accounts. Second, a significant fraction of AI productivity gains accrues through quality improvements in professional outputs — more rigorous analysis, faster iteration, reduced error rates — that are not captured by output price deflators calibrated against legacy product categories. Third, the micro-enterprise channel, which may absorb a large fraction of the surplus under the distributed equilibrium scenario, is poorly tracked in national statistics: self-employment income is under-measured, productivity growth in the unincorporated business sector is imputed rather than directly observed, and platform-mediated gig work sits in measurement grey zones. The practical implication is that policymakers and central bankers should expect a period in which AI-driven surplus is economically real but statistically invisible — and should resist interpreting measured productivity stagnation as evidence of technological underperformance.
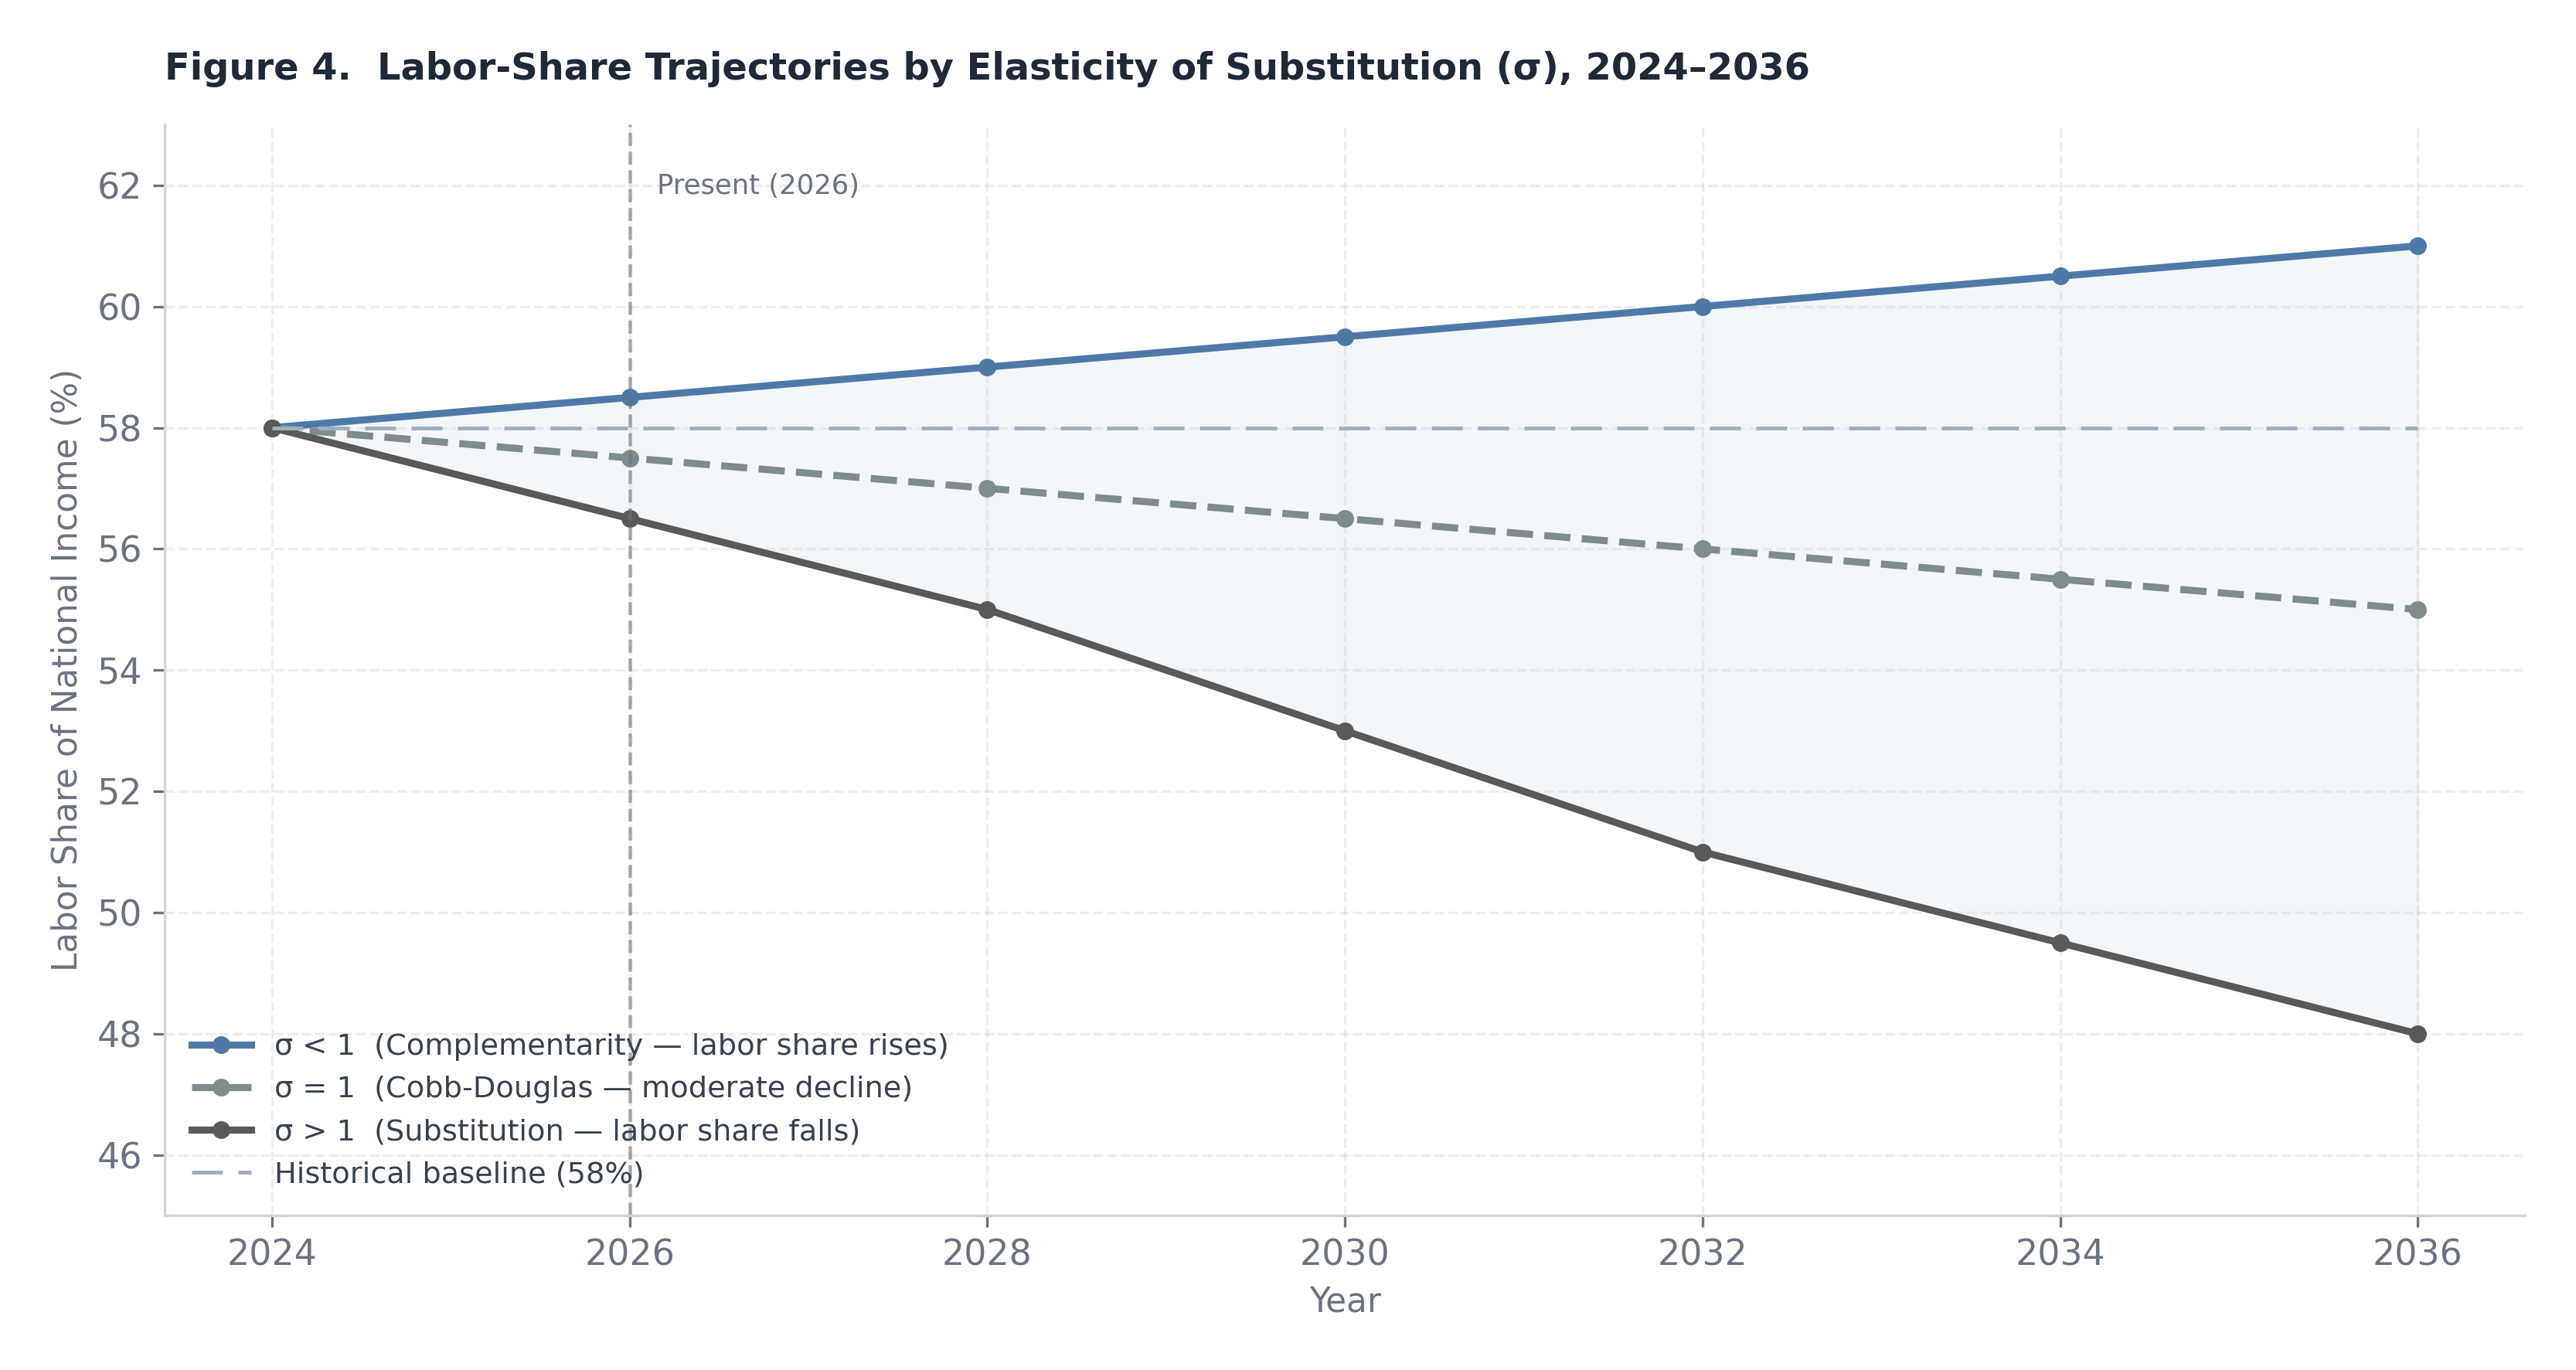
Figure 4. Scenario-based labor-share trajectories under distributed, hybrid, and platform-dominant equilibria.
A rigorous analysis of the Convergence Economy’s long-run distributional consequences requires a production-function framework capable of representing the substitutability relationship between AI capital and human labor. The standard CES (constant elasticity of substitution) production function provides the appropriate vehicle:
Y = A[αK(KAI)ρ + αL ⋅ Lρ]1/ρ
where Y is aggregate output, A is total factor productivity, K_AI is the stock of AI-embodied capital (including compute infrastructure, trained model weights, and AI-augmented software systems), L is effective labor input, α_K and α_L are distribution parameters governing the relative intensity of each factor, and ρ is the substitution parameter. The elasticity of substitution between AI capital and labor is then given by:
σ = 1/(1−ρ)
The value of σ is the pivotal structural parameter for labor-share dynamics. When σ > 1, capital and labor are gross substitutes: as AI capital becomes cheaper relative to labor, firms substitute toward it, and the labor share of output declines. When σ < 1, capital and labor are gross complements: increased AI capital deployment raises the marginal product of labor, driving wages up, and the labor share is approximately stable or potentially rises. When σ = 1, the production function collapses to the Cobb-Douglas form, in which factor shares are determined entirely by the distribution parameters and are independent of relative factor prices.
The empirical question of whether σ exceeds or falls short of unity is neither settled by theory nor by existing empirical estimates, which vary substantially by sector, skill tier, and task granularity. The Convergence Economy’s distinctive feature is that it does not impose a single regime: different sectors and different task categories face different substitutability environments, and the aggregate economy-wide σ is best understood as a capacity-weighted average across a heterogeneous sector distribution.
Two limiting regimes define the analytic space. Under complementarity dominance (σ < 1), AI capital deployment raises the effective productivity of each unit of labor rather than replacing it. An attorney who can perform exhaustive case-law research in minutes rather than hours is more productive, not redundant; a financial analyst whose modeling time compresses from days to hours can cover more clients, generate more insights, and command a wage premium reflecting the expanded scope of deliverables. In this regime, the labor productivity term in the production function rises faster than AI capital deployment compresses headcount demand, and wages increase proportionally with productivity. The labor share of output remains approximately stable, and the primary distributional effect of AI is to shift the wage distribution toward skill tiers that complement AI output — creating significant within-labor inequality even as the aggregate labor share holds.
Under substitution dominance (σ > 1), AI capital is deployed to reduce headcount rather than augment it. The marginal cost of an AI-generated deliverable falls below the marginal cost of a human-generated equivalent, and rational firms substitute toward the cheaper input. Labor demand declines at the margin, wage bargaining power weakens as the outside option for employers (AI replacement) becomes credible and affordable, and the capital income share rises at the expense of labor. This regime does not require mass layoffs or dramatic short-run displacement; it can manifest as a persistent structural slowdown in employment growth in affected sectors, wage stagnation below productivity growth, and an expansion of corporate margins that is systematically not passed through to compensation.
The Convergence Economy almost certainly produces mixed regimes distributed unevenly across the sectoral landscape. Infrastructure and platform sectors — compute, logistics, software development, financial operations — are plausibly substitution-heavy, as the primary value of AI in these domains is cost reduction and throughput expansion rather than quality enhancement. Relational and judgment-intensive sectors — complex legal advocacy, executive advisory, healthcare diagnosis, high-touch client management — are more plausibly complementarity-heavy, as human judgment, relational trust, and contextual authority retain scarcity value that AI output cannot fully replicate at current capability levels. The aggregate distributional outcome will be determined by which sector group expands and which contracts as a share of economic activity over the decade ahead.
The Convergence Economy introduces a structural mechanism that distinguishes it from prior waves of labor-displacing technology: the simultaneous compression of both cognitive labor costs and transaction costs. Prior automation waves — numerical control manufacturing, enterprise resource planning, early software — primarily compressed routine manual and clerical labor, leaving the professional-managerial wage mass relatively intact and indeed expanding it as organizational complexity increased. The current transition attacks at a different stratum. Knowledge work — analysis, documentation, synthesis, compliance, and research — constitutes the core of the white-collar wage mass, and it is precisely these task categories where current-generation AI systems demonstrate the highest effective substitutability.
This matters for aggregate labor-share dynamics because the white-collar wage mass represents a disproportionate share of total compensation. The United States labor share of GDP has declined from approximately 60 percent of national income in the mid-twentieth century to the 53–55 percent range in recent years, a trend conventionally attributed to globalization, offshoring of manufacturing, the automation of routine production labor, skill-biased technological change, and capital deepening. The Convergence Economy augments this secular decline with a new compression mechanism that operates on precisely the labor tiers that had previously been insulated from displacement: the cognitive, credentialed, and higher-income professional workforce. If AI-driven productivity gains in these tiers accrue primarily to corporate margins rather than to labor compensation or independent income generation, the labor share trajectory worsens materially from an already historically depressed baseline.
The structural fork is therefore as follows: if AI primarily raises corporate margins in professional services and information industries — through headcount reduction, pyramid compression, and per-unit cost deflation — the labor share declines further, income concentration rises, and the political economy of redistribution intensifies. If, alternatively, AI enables a proliferation of distributed operator income — allowing former analysts, associates, and junior professionals to operate as independent practitioners at near-incumbent output quality — then the labor share can be approximately preserved, though the vehicle shifts from wage employment to self-employment income. This is not merely a productivity story. It is a distributional bargaining story, and the outcome depends on structural features of the market that lie outside the production function itself: procurement norms, platform governance, professional licensing architecture, and the degree of open-model access.
Even under scenarios where the long-run equilibrium is relatively benign — a distributed AI economy with moderate labor share stability — the transition path involves frictions that can impose substantial and unevenly distributed short-run costs. Retraining lags are the most analytically tractable: the skills required to operate as an effective AI-augmented independent practitioner — prompt engineering fluency, workflow design, quality validation, client positioning — are neither trivially acquired nor uniformly distributed across the incumbent workforce. Older workers, workers in geographically concentrated industry clusters, and workers in highly credentialed professions with strong licensing barriers face the highest transition costs and the longest adjustment horizons. Geographic immobility compounds this dynamic: the sectors most exposed to AI compression — professional services, financial operations, legal documentation, software — are geographically concentrated in a small number of metropolitan areas, and the alternative income opportunities available in those areas may be more limited than aggregate employment statistics suggest. Benefits structure rigidity introduces a third friction: employer-sponsored health insurance, defined-benefit pension residuals, and other firm-linked benefits create implicit lock-in that delays voluntary transition to independent operator status even where the income opportunity is demonstrably superior.
The macroeconomic policy implications of these dynamics are consequential and likely underappreciated by current institutional frameworks. In the near to medium term, AI-driven cost compression in professional services will exert sustained downward pressure on the price of knowledge-intensive outputs: legal fees, consulting rates, software development costs, and financial advisory margins will face deflationary pressure. For central banks, this service-sector disinflation may initially read as a favorable supply-side shock — declining inflation with stable or rising output — consistent with durable productivity expansion. The risk is that monetary authorities mistake margin-driven price stability for genuine productivity acceleration, maintain accommodative stances longer than warranted, and fail to build in sufficient slack for the eventual realization that measured productivity growth has not matched the financial market valuations that the AI narrative has supported.
On the fiscal side, the distributional consequences of the Convergence Economy create two distinct challenges depending on which scenario materializes. If capital concentration increases and the infrastructure-dominant scenario prevails, fiscal redistribution pressures intensify rapidly: wealth concentration accelerates, the wage tax base erodes, and the political economy around wealth and capital income taxation resurfaces with renewed urgency. Meaningful policy responses would include infrastructure rent taxation, AI-specific capital income surtaxes, and productivity dividend mechanisms designed to return a portion of AI-generated surplus to displaced workers. If, alternatively, the micro-enterprise proliferation scenario prevails, the fiscal challenge shifts toward the revenue base: a large and growing self-employed population generates income through platforms, project markets, and direct client relationships that are substantially more difficult to observe and tax than wage income. Compliance modernization — real-time reporting infrastructure, platform withholding requirements, and streamlined estimated tax systems — becomes a fiscal priority not as a punitive measure but as an enabling condition for sustainable public finance in a distributed income economy.
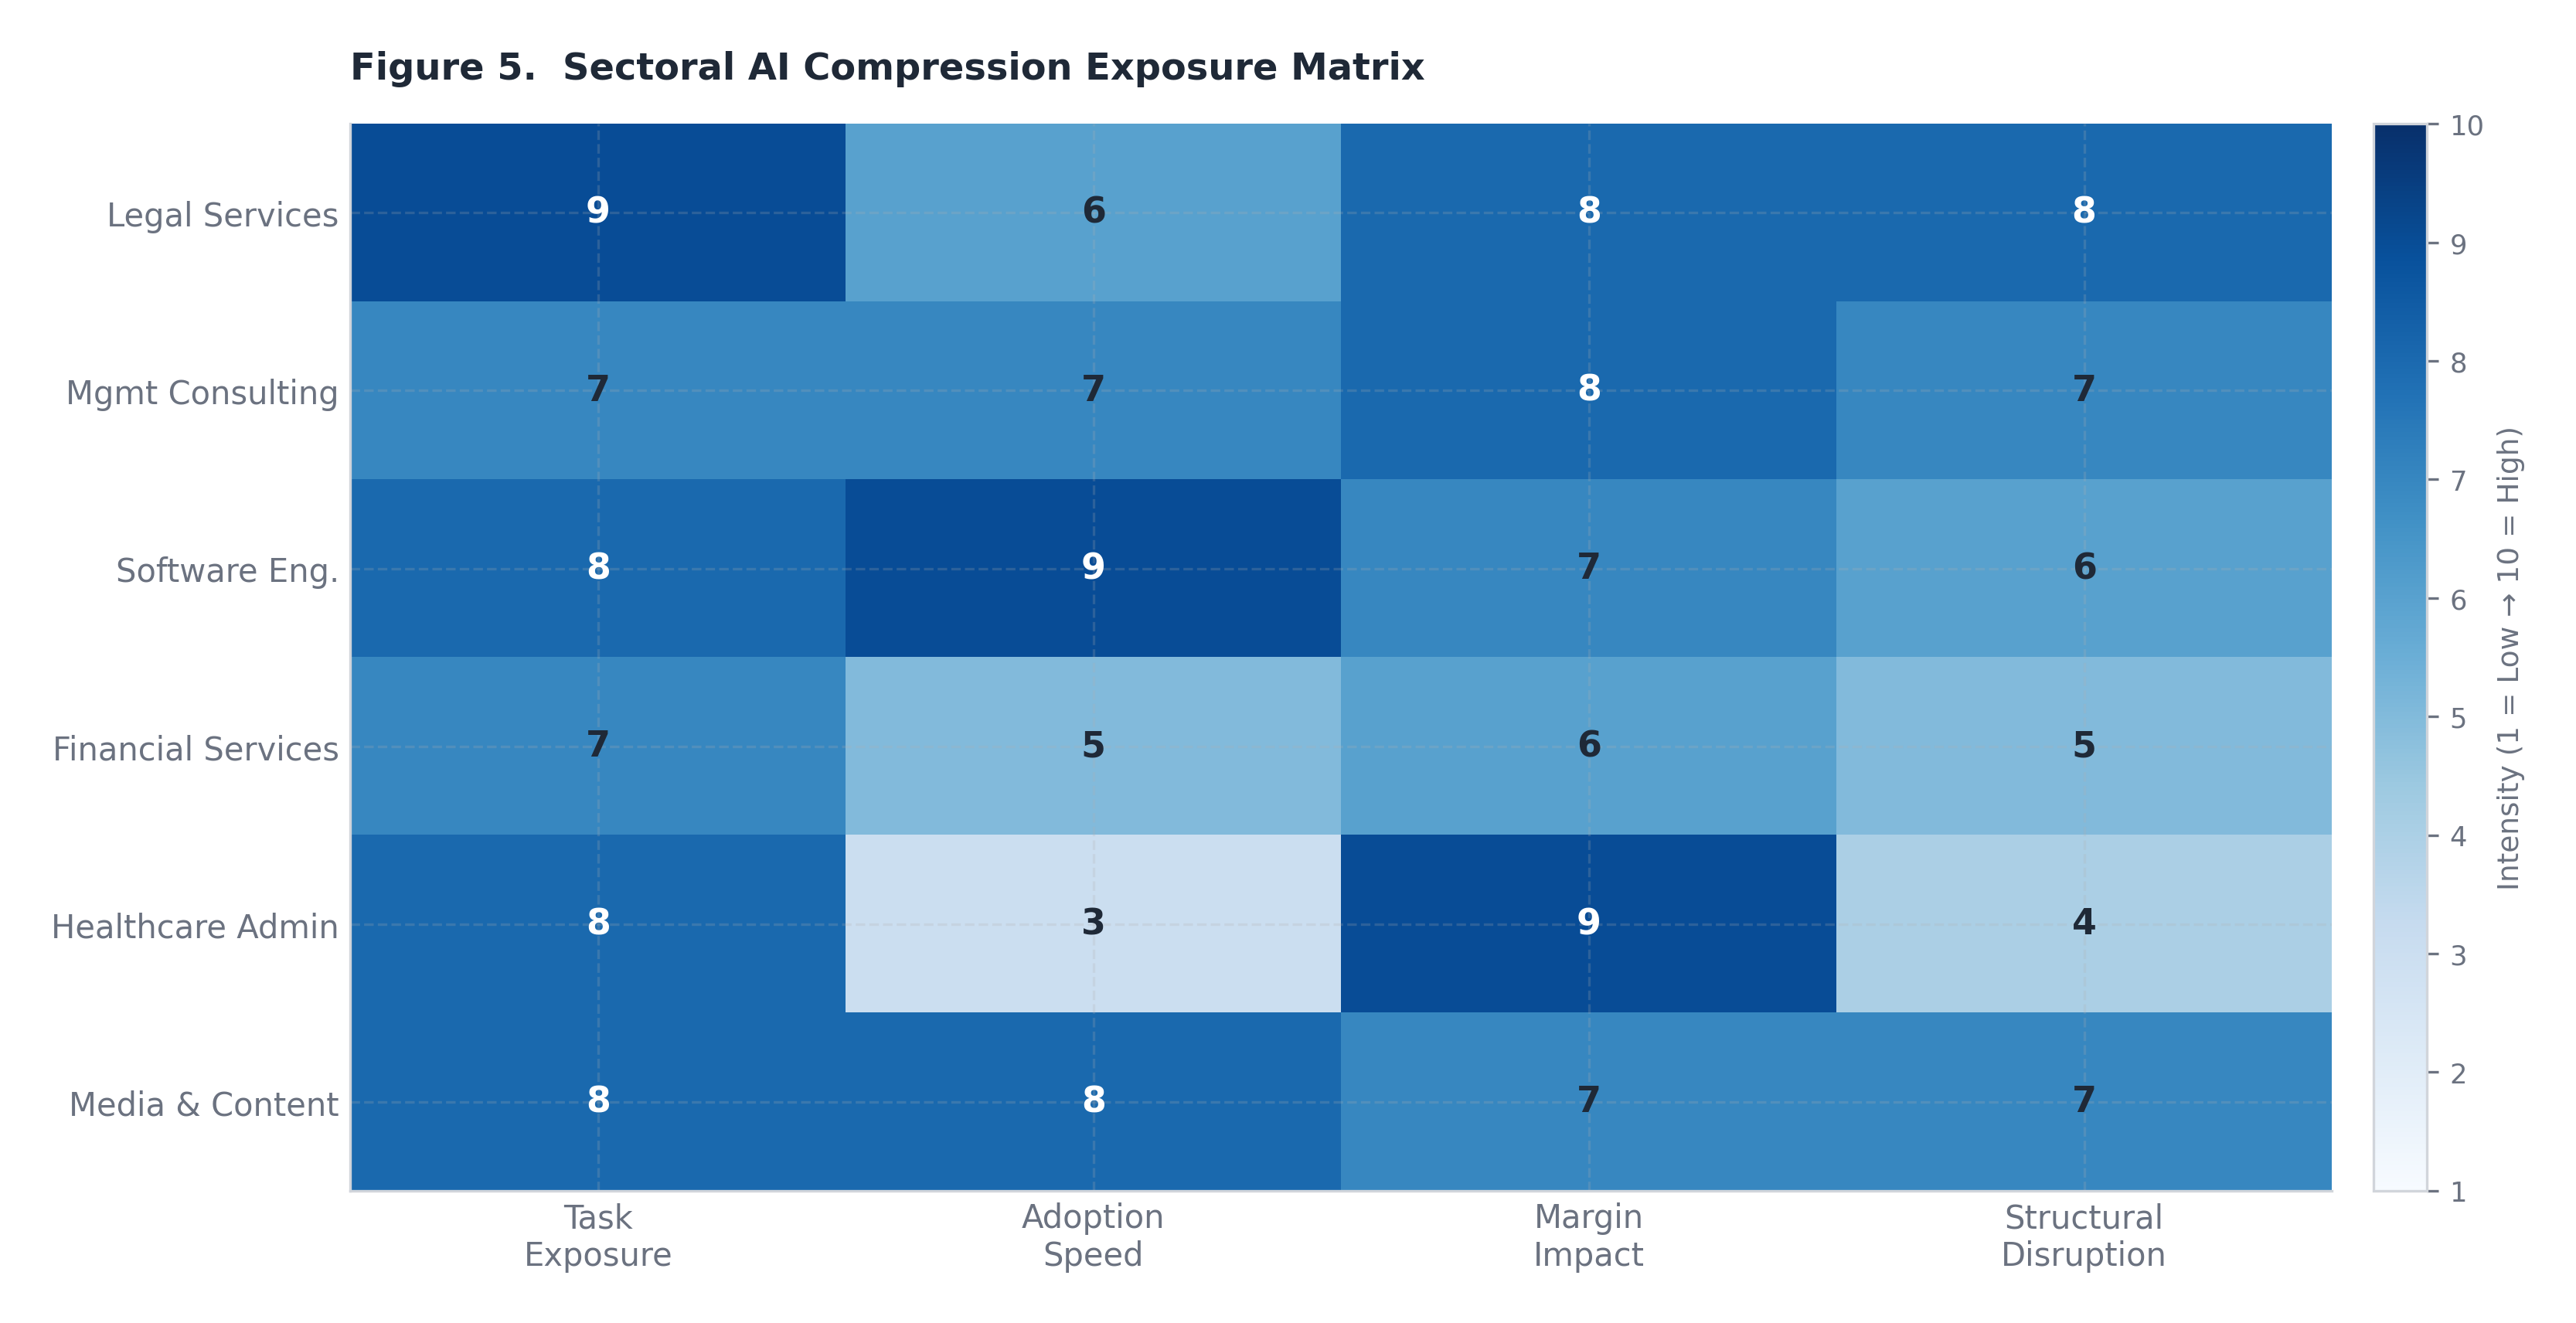
Figure 5. Relative sectoral intensity scores for AI compression exposure, settlement leverage, regulatory constraints, and transition friction. The microeconomic and general equilibrium dynamics analyzed in the preceding sections manifest differently across sectors, with variation determined by regulatory environment, the composition of compressible versus non-compressible task categories, and the legacy organizational structures through which AI compression must be absorbed. This section examines six sectors in depth.
Financial services occupies a position of unusual strategic complexity in the Convergence Economy: it is simultaneously one of the most heavily exposed sectors and one of the most institutionally constrained in its capacity to absorb transformation rapidly. The exposure dimensions are broad and deep. Middle-office operations — model documentation, stress testing narrative, risk committee reporting, regulatory capital attribution — represent substantial professional headcount that is directly addressable by current-generation AI systems. Compliance functions, whose cost base has grown dramatically in the post-2008 regulatory environment, involve significant volumes of document review, regulatory interpretation, and reporting cycle management that AI can compress materially. Treasury operations, particularly in multi-entity corporate and institutional contexts, involve liquidity management, counterparty credit surveillance, and collateral optimization tasks that are ripe for AI-augmented automation. Cross-border payment operations, where the latency and cost structure of correspondent banking creates ongoing friction, face structural pressure from both AI-optimized workflow tools and from the emergence of stablecoin settlement rails that compress wire timing from days to seconds and reduce per-transaction cost by an order of magnitude.
The strategic implications for institutional incumbents are layered. In the near term, the most visible consequence is a structural shift in the composition of compliance and risk functions: fewer junior analysts performing manual document review and regulatory research, and more AI supervisors — hybrid roles defined by the capacity to design, validate, and oversee AI-generated outputs rather than produce them directly. This role transformation will compress headcount growth at the analyst and associate tier while potentially creating modest demand for a new category of technically fluent oversight professionals. More disruptively, the rise of AI-native risk and compliance boutiques — small teams of domain experts operating AI systems capable of replicating the output of much larger internal teams — will introduce genuine competitive pressure on internal functions that have historically been justified as scale-intensive. If an external provider can deliver regulatory reporting and model documentation at lower cost than an in-house team of comparable output quality, the institutional calculus for internalization weakens.
Settlement infrastructure modernization compounds this competitive dynamic. As programmable escrow mechanisms, automated settlement triggers, and stablecoin rails mature, the institutional intermediary layers that currently extract revenue from timing friction and counterparty risk management face margin compression. Treasury modernization — the ability to programmatically manage liquidity across entity structures in near real time — reduces dependence on the short-term funding and cash management services that have historically represented a stable revenue source for commercial banks and custodians. The board-level metrics that should guide strategic planning in this environment include model provider concentration ratios (measuring operational dependency on a small number of AI vendors), settlement rail diversification scores, and regulatory audit readiness indices that reflect AI-generated documentation quality under examiner scrutiny. The foundational strategic question is not whether to deploy AI but which functions remain genuinely core to internalize when external AI-augmented operators can replicate output at lower unit cost — and what organizational capabilities constitute durable competitive advantage when the labor arbitrage that previously justified internalization has eroded.
Few sectors face as direct and structurally consequential an exposure to AI-mediated compression as management consulting and professional advisory services. The traditional consulting business model is built on a specific form of labor arbitrage: experienced partners and managing directors, who command premium fees and generate institutional relationships, leverage their time through a pyramid of more junior resources — managers, senior associates, analysts — who perform the research, modeling, data assembly, and document production that constitute the bulk of deliverable hours. The economics of this model are well understood: a small number of senior professionals generate revenue at rates that are multiples of their direct cost, the pyramid structure enables the firm to absorb volume fluctuations, and client willingness to pay reflects the perceived credibility of the senior relationship as much as the intrinsic value of any individual deliverable.
AI compresses the analyst and associate layers most heavily and most immediately. The task categories that define junior consulting work — market sizing, competitive landscaping, financial benchmarking, presentation drafting, qualitative synthesis of interview notes — are precisely the categories where current-generation AI systems demonstrate high effective substitutability at acceptable output quality. A single senior professional operating with well-designed AI tooling can produce outputs that previously required a team of three to five junior resources, completing deliverable cycles in days rather than weeks. In the short run, this creates significant margin expansion for incumbent firms: the revenue model does not immediately compress because clients continue to price advisory engagements based on established brand and relationship value, while the cost base shrinks as junior hiring slows. This margin expansion phase, however, contains the seeds of a more fundamental structural disruption.
The medium-run consequences are more corrosive to the traditional model. As AI capability becomes commoditized and clients develop sophistication about what AI can deliver independently, the value proposition of a large advisory pyramid becomes harder to defend. The rise of two-to-five person AI-native advisory practices — small teams of highly experienced domain experts who use AI to produce consulting-grade output at dramatically reduced cost and timeline — creates a competitive alternative that is structurally advantaged on unit economics. These firms cannot replicate the global delivery network or brand capital of a McKinsey or BCG, but for a significant proportion of advisory mandates — particularly those where diagnostic rigor and analytical depth matter more than brand signaling or implementation scale — they represent a credible and cost-effective substitute. The billable-hour pricing model faces particular pressure: when the primary driver of fees was labor time and senior oversight of junior effort, hourly billing was a natural metric. When AI compresses the time required for analytical deliverables, hourly billing systematically underprices expertise and overprices production. The strategic pivot that preserves long-run margin in this environment is a shift from labor-leverage models to expertise-plus-brand-plus-relationship models, and from time-based to outcome-based pricing — in which the fee reflects the value of the insight or decision supported, not the hours of professional time logged.
Legal services presents a more stratified exposure profile than consulting. The profession encompasses a wide range of task categories that differ dramatically in their AI substitutability, and understanding this heterogeneity is essential to accurately characterizing the sector’s transformation trajectory. At one end of the substitutability spectrum, the tasks that define high-volume legal work in large firms and corporate departments — discovery document review, contract drafting and markup, legal research and citation, regulatory filings and compliance memoranda — are highly compressible. AI systems have already demonstrated performance in these categories that meets or exceeds junior associate quality standards on a per-document basis, at a fraction of the cost and time. The economics of discovery review in particular, a category that has historically consumed enormous associate hours in major litigation, have shifted fundamentally: firms and legal operations departments that do not deploy AI in this category are at a structural cost disadvantage relative to those that do.
At the other end of the substitutability spectrum, the tasks that define the most remunerative legal work — complex commercial negotiation, courtroom advocacy, jury persuasion, appellate strategy, and the exercise of judgment in novel regulatory or transactional contexts — retain a high degree of human non-substitutability. These tasks require not merely the retrieval and synthesis of legal information but the contextual application of strategic judgment, the reading of human dynamics, and the authority that derives from professional credentialing and personal reputation. AI augments the preparation for these activities significantly; it does not replicate the activities themselves.
The structural consequence of this asymmetry is a bifurcation of the legal services market. Small AI-augmented practices staffed by experienced attorneys operating with advanced legal AI tooling will increasingly dominate the market for routine documentation, contract review, compliance advisory, and high-volume transactional work — winning on cost efficiency and turnaround speed. Large firms will retain competitive advantage in complex litigation, major M&A advisory, regulatory crisis management, and practice areas where the institutional brand and team depth of a global firm represent a material client benefit. The segment facing the most acute strategic pressure is the mid-tier firm: large enough to carry the overhead of a multi-partner structure but insufficiently specialized or branded to compete with either the cost efficiency of AI-augmented boutiques or the institutional prestige and scale of global firms. Regulatory adaptation in the legal sector will lag behind technical capability, as bar associations, court systems, and professional responsibility frameworks grapple with disclosure obligations, unauthorized practice rules, and malpractice standards applicable to AI-generated legal work — creating a period of regulatory uncertainty that may paradoxically protect incumbent cost structures while the governance architecture catches up.
The media and marketing sector confronts AI-driven compression with a combination of acute short-run disruption and a more durable long-run competitive restructuring that actually rewards a different kind of asset than the one currently most valued. The compression dynamics are acute and already manifest: the cost of generating competent written content, graphic design assets, advertising copy variations, video scripts, and social media material has fallen by an order of magnitude with the deployment of current-generation AI tools. Marketing teams that previously required large content production workforces to maintain publishing cadences across multiple channels can now achieve equivalent output volume with dramatically reduced headcount. This is not speculative — the contraction in content marketing employment observable in the 2023–2025 period reflects this dynamic directly.
The more interesting strategic question is what the cost compression of content production reveals about the underlying value architecture of media and marketing. When production capacity was scarce and expensive, having a large creative team was a competitive moat. When production capacity is abundant and cheap, the binding constraint shifts upstream to the inputs that AI cannot commoditize: narrative originality, brand voice authority, audience trust, and distribution reach. The creative differentiation that matters in an AI-saturated content environment is not the ability to produce at scale — any organization can do that — but the capacity to produce content that carries genuine epistemic or emotional authority with a specific audience. Independent creators who have built authentic relationships with defined communities are, paradoxically, better positioned in this environment than large content factories whose competitive advantage was volume production, because the scarcity they represent — genuine human perspective and earned trust — is precisely what AI abundance makes more valuable in contrast.
For enterprises, the strategic reorientation is from a production moat to a distribution and trust moat. The marketing function that retains durable competitive advantage is the one that commands preferential distribution access — algorithmic, editorial, or relational — and maintains brand authority that makes content credible and persuasive, not merely visible. Attention scarcity, not production cost, is the binding constraint in the AI media economy. The implication for organizational design is significant: marketing teams contract on production capacity and expand on strategy, audience intelligence, brand governance, and distribution architecture — a fundamental inversion of the historical resource allocation.
Software development occupies a distinctive position in the Convergence Economy: it is both a sector with high AI-compression exposure and the primary delivery mechanism through which AI capabilities reach every other sector. The compression dynamics within software development are real and accelerating. Code generation, test case production, documentation drafting, bug diagnosis, and API integration scaffolding — tasks that constitute a large fraction of the working hours of junior and mid-level developers — are increasingly addressable by AI coding tools at output quality that is either immediately deployable or requires modest human review. Developer productivity metrics at early-adopter firms show substantial gains in these categories, and the economics of software team composition are shifting toward smaller teams capable of maintaining larger codebases.
The task categories that remain less fully compressible are revealing: system architecture design, security engineering, infrastructure orchestration, and the definition of high-level system requirements against complex business objectives all require a depth of contextual judgment, cross-system reasoning, and risk sensitivity that current AI systems do not reliably provide without substantial human oversight. The pattern this creates at the sector level is an asymmetric fragmentation: application-layer software development — the production of new applications built on top of existing infrastructure APIs and frameworks — fragments dramatically, as the cost and expertise barrier to shipping functional software falls toward marginal. Infrastructure-layer development — the design and maintenance of operating systems, database engines, networking protocols, and AI training systems — consolidates toward a smaller number of highly capitalized and deeply specialized organizations, because the complexity, security requirements, and long-horizon investment theses of this work are if anything better served by concentrated, expert teams. The strategic risk that emerges from this pattern is compute dependency: as application firms proliferate on top of a concentrated infrastructure layer, the negotiating dynamic between the two tiers shifts in ways that echo the dynamics of earlier platform consolidation — with the infrastructure layer capturing increasing rent from an application ecosystem that has limited credible alternatives.
Healthcare represents the most regulation-gated of the high-exposure sectors, and the interaction between clinical governance requirements and AI deployment creates a distinctive adoption pattern characterized by high near-term administrative compression and slow near-term clinical integration. The administrative cost burden of the U.S. healthcare system is well-documented: billing and insurance-related activities, prior authorization workflows, clinical documentation and coding, appointment scheduling, and regulatory compliance reporting together account for a substantial fraction of total healthcare cost — estimates range widely but consistently place administrative overhead above 25–30 percent of total system cost. These categories are highly compressible. Medical billing, insurance claim processing, prior authorization letter generation, ICD coding, clinical note drafting from provider dictation, and patient scheduling optimization are all well within the demonstrated capability envelope of current-generation AI systems, and deployment is already underway at material scale.
Clinical applications face a fundamentally different governance environment. Diagnostic AI systems, treatment recommendation engines, and clinical decision support tools require regulatory review pathways — FDA clearance or de novo authorization in the U.S. context — that impose substantial time and cost burdens on deployment, and the liability architecture around AI-assisted clinical errors remains unsettled in ways that create institutional caution. The principle of human oversight for diagnostic and treatment decisions reflects both genuine regulatory requirement and the practical reality that the stakes of clinical error are categorically different from the stakes of an administrative mistake. This creates a sector-specific dynamic in which AI adoption accelerates in administrative functions at a rate closer to financial services or professional services, while clinical AI deployment follows a longer and more expensive approval trajectory that differs by modality and indication. The practical near-term opportunity is substantial on the administrative side: health systems that deploy AI comprehensively across billing, documentation, and scheduling functions can achieve cost reductions that improve operating margins significantly — a material consideration for institutions operating on historically thin margins in the post-pandemic environment. Data governance complexity intensifies as these systems expand: HIPAA-compliant AI deployment, patient data minimization, model audit trails, and algorithmic fairness obligations all add implementation overhead that may slow adoption relative to less regulated sectors, even where the technical capability exists and the economic case is strong.
The sectoral dynamics analyzed above converge on a common set of governance imperatives. Whether in financial services, professional advisory, legal, or technology, the institutional challenge is the same: how to redesign organizational architecture for a world where intelligence and coordination costs are compressing simultaneously. This section develops the governance and organizational design implications at the firm level.
For most of the post-industrial era, competitive advantage in knowledge-intensive industries derived from a predictable constellation of structural moats: scale economies in production and distribution, privileged access to capital markets, accumulated regulatory relationships, proprietary talent aggregation, and the information asymmetries that accompany depth of institutional knowledge. Under the conditions of dual compression described in preceding sections — simultaneous collapse in the cost of intelligence and in the friction cost of coordination — several of these moats are narrowing with material speed. The board-level strategic question has therefore changed. It is no longer primarily how do we scale? but rather: what remains defensible when intelligence and coordination costs converge toward near-zero?
The answer is more constrained than many boards currently appreciate. Five categories of durable competitive position remain viable under dual compression. First, trust capital — the accumulated credibility with clients, regulators, and counterparties that cannot be manufactured programmatically. Trust is slow to build, costly to repair, and difficult to simulate with AI-generated outputs. Second, regulatory capital — the institutional knowledge, licensed relationships, and compliance infrastructure embedded in regulated industries such as financial services, healthcare, and legal. Third, relationship capital — the senior advisory relationships, board-level access, and network connectivity that govern high-stakes decision-making. Fourth, infrastructure capital — ownership or deep integration with the compute, settlement, and distribution rails that the broader ecosystem depends upon. Fifth, data capital — proprietary, longitudinal, structured datasets with network effects that are not replicable by general-purpose models.
Labor aggregation alone — the hiring of large numbers of skilled professionals to execute repeatable cognitive tasks — no longer constitutes a durable moat in compressible domains. The strategic implication is direct: institutions that mistake headcount accumulation for competitive depth are building structures optimized for a cost environment that is in the process of becoming obsolete.
Traditional make-vs-buy analysis rested on a coherent economic logic: internalize when market transaction costs exceed internal coordination costs, when quality control requires close supervision, when intellectual property is insufficiently protected by contractual frameworks, and when coordination overhead degrades inter-firm performance. The original Coasian formulation has guided organizational design for eight decades.
Under the conditions of AI-native micro-enterprise proliferation and programmable settlement, each of these inputs is being repriced. Transaction costs decline as conditional payment execution reduces enforcement friction and settlement latency. Quality standardization increases as AI tooling normalizes output across independent operators — a modular content producer, compliance analyst, or software developer operating with best-in-class tools will increasingly deliver outputs indistinguishable in baseline quality from those produced internally. Intellectual property control becomes increasingly manageable through modular contractual licensing frameworks rather than requiring employment relationships. And coordination overhead, previously the decisive argument for internalization, declines as AI-augmented project management and real-time workflow orchestration reduce the supervisory friction involved in managing distributed operator networks.
The consequence is a material shift in the equilibrium boundary condition for internalization. Expressed formally: the historical inequality TC_market > TC_internal that justified organizational expansion is narrowing, and in compressible task domains may be reversing. Boards must therefore re-examine, with genuine rigor rather than rhetorical incrementalism, which functions require internal employment relationships and which can be modularized without strategic loss. The relevant analytical categories are distinct: certain functions must remain internal because they anchor trust capital, regulatory standing, or strategic judgment — this is non-negotiable. Other functions can be modularized because outputs are standardizable and quality variance is acceptable within contractual tolerances. Still others require trust-layer ownership — not employment per se, but deep preferential access and information-sharing relationships with specific external operators. Failure to revisit make-vs-buy boundaries in light of these structural cost shifts will leave institutions operating substantially above efficient organizational frontier, locking in labor models that generate structural overhead without proportionate strategic return.
The most credible emergent organizational architecture under dual compression is a two-tier model: a lean, senior-heavy internal core augmented by an AI-enabled peripheral operator network. This structure is not without historical precedent — it mirrors the evolution of manufacturing supply chains from vertically integrated production to orchestrated global networks of specialized suppliers. The decisive difference is that the current transition applies the same logic to cognitive production rather than physical assembly.
The internal core handles strategy formation, client relationship governance, risk oversight, capital allocation, regulatory management, and the institutional judgment functions that cannot be modularized without compromising competitive position or fiduciary integrity. Critically, the core is also responsible for the architecture of the peripheral network itself — supplier accreditation, quality framework design, workflow orchestration, and the trust standards that govern external operator integration. The peripheral network consists of AI-augmented modular operators: independent consultants, specialized micro-enterprises, project-based specialists, and platform-based freelance networks. These operators produce standardized cognitive outputs — analysis, content, code, compliance documentation — at unit economics substantially below those of comparable internal FTEs.
The board’s governance task is to define three boundaries with precision: what constitutes core (non-negotiable internalization), what constitutes modular (eligible for external delivery), and what is infrastructure-dependent (requiring contractual depth without full employment). Institutions that draw these boundaries carelessly — either by over-retaining modular functions out of organizational inertia, or by over-externalizing functions that anchor strategic credibility — will encounter either structural cost disadvantage or institutional fragility. The boundary definition exercise is not a one-time reorganization but an ongoing governance function that will require reassessment as the cost and capability frontier of AI tools continues to evolve.
The shift toward AI-augmented production and programmable settlement introduces a materially different risk architecture from the one most institutional boards currently govern. Four new risk vectors warrant explicit incorporation into enterprise risk frameworks.
Model Risk encompasses hallucination risk, regulatory misinterpretation, incomplete-data bias, and version drift. Unlike human error, AI model failures can be systematic rather than idiosyncratic — errors propagate across all users of a given model version simultaneously, and may not be immediately detectable through conventional output review. Governance must introduce AI model validation layers analogous to model risk management frameworks in quantitative finance: independent back-testing, output verification protocols, change-management controls for model version updates, and documented audit trails that satisfy regulatory scrutiny.
Infrastructure Concentration Risk reflects the operational dependency organizations are accumulating on a small number of AI model providers and compute platforms. The risk is not merely reputational but operational and systemic: a service interruption, pricing restructuring, or regulatory action affecting a dominant provider can cascade across institutional operations at speed. Boards should monitor infrastructure exposure concentration ratios, compute dependency indices, and settlement rail diversification with the same diligence applied to credit concentration in lending portfolios.
Cyber and Systemic Liquidity Risk in AI-agent networks is a genuinely novel category. Where agentic AI systems execute transactions autonomously — and particularly where programmable settlement enables high-frequency automated payment execution — the speed of error propagation increases substantially relative to human-supervised systems. Smart contract vulnerabilities, stablecoin liquidity pooling concentrations, and counterparty failure scenarios must be stress-tested through automated payment cascade simulations, and institutions operating with meaningful settlement rail exposure should maintain pre-negotiated liquidity backstop arrangements.
Model Drift and Agentic Feedback Loops represent a subtler but potentially consequential risk. AI systems trained on market or institutional behavior may develop feedback dynamics wherein their own prior outputs become part of the training or input environment, creating self-referential distortions in recommendations and decisions. This risk is currently underweighted in most enterprise AI governance frameworks.
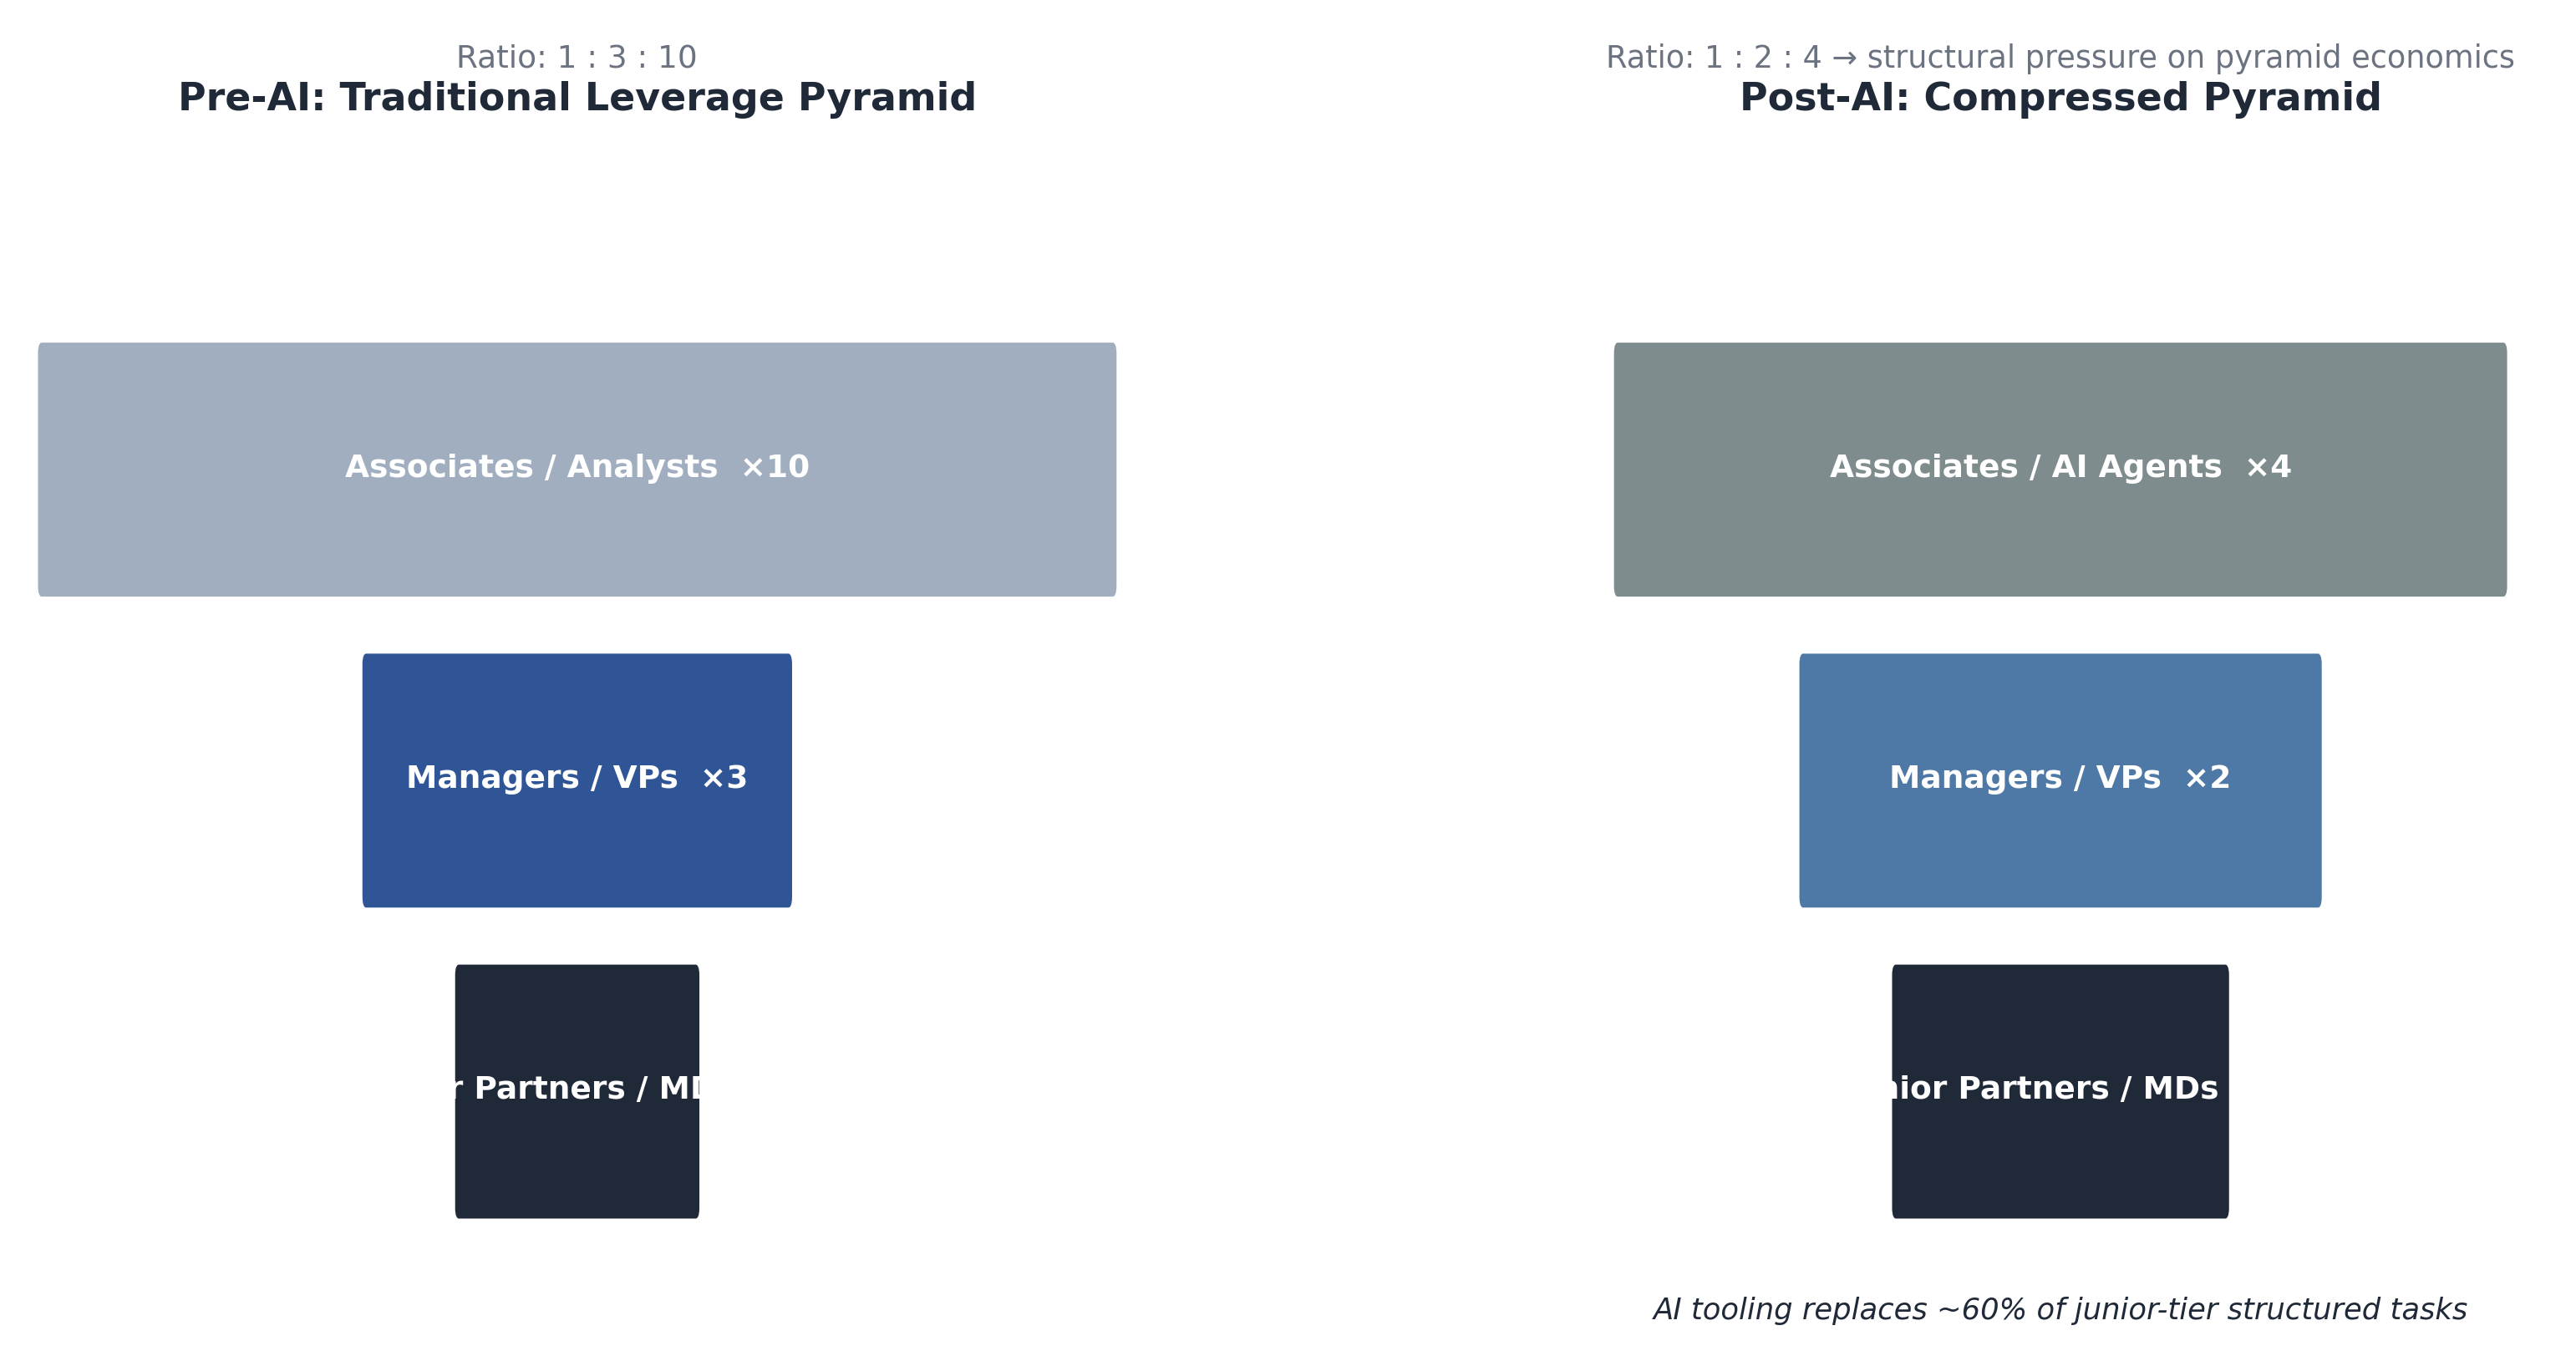
Professional services — consulting, legal, financial advisory, audit — built their organizational models on a durable structural insight: expertise is scarce and non-replicable, but analytical and procedural labor is abundant and trainable. The resulting leverage pyramid allocated a small number of senior experts to relationship management and high-judgment synthesis, while large junior staffing tiers executed research, analysis, drafting, and compliance tasks under senior supervision. Revenue per senior professional was amplified by the productivity of the supporting pyramid, and the pyramid itself functioned as a talent pipeline — the training ground for future senior practitioners.
AI compression attacks the pyramid at its base. Document review, financial modeling, initial legal research, code generation, market analysis, and standard report drafting are among the earliest and most materially affected task categories. As AI tools absorb these functions, the economic justification for large junior tiers declines. Organizational design must adapt accordingly: smaller senior cores, AI-native workflow design that routes standardized analysis directly to AI agents, modular expertise nodes for specialized functions that remain non-compressible, and project-based integration of external specialists where depth is required but continuity is not.
The talent moat shifts in character. The traditional competitive advantage of hiring more analysts is supplanted by the advantage of hiring fewer, substantially more capable, AI-fluent strategists who can orchestrate AI workflows, validate model outputs, exercise institutional judgment, and manage distributed operator networks. The emerging premium capabilities are prompt engineering at institutional scale, cross-model validation and output synthesis, AI workflow architecture, and distributed operator governance. Institutions that recognize this transition early and restructure their hiring, compensation, and promotion models accordingly will accumulate a generational advantage in cost structure and organizational agility.
It would be analytically incomplete to discuss organizational redesign without acknowledging that the greatest near-term obstacle is neither technological nor economic but institutional. AI compression directly threatens the status hierarchies, compensation structures, and internal power dynamics that define professional identity in knowledge-intensive organizations. Junior professionals who expected to spend years building expertise through apprenticeship face compressed career trajectories. Senior professionals whose competitive position derived partly from control of information and methodology face disintermediation by tools that democratize those capabilities. Organizational leaders whose authority was legitimized by long tenure and deep procedural knowledge face structural challenges to that legitimacy.
These dynamics generate institutional resistance that is rational at the individual level and costly at the organizational level. Boards that respond by suppressing organizational adaptation to protect near-term cultural stability may preserve internal morale at the cost of medium-term competitive position. The appropriate governance response is neither to impose restructuring without cultural acknowledgment nor to defer restructuring indefinitely in deference to cultural comfort. Optimal adaptation velocity — the rate at which the organization realigns its structure with the new cost frontier — is itself a strategic variable, subject to calibration based on competitive dynamics, talent market conditions, and regulatory environment. The institution that adapts too slowly cedes competitive ground; the institution that adapts too abruptly risks the institutional knowledge, client trust, and cultural cohesion on which its core advantage depends.
As a practical governance instrument, boards should implement surplus monitoring dashboards that track in near-real time where AI-generated cost savings are flowing: to corporate profit margins, to pricing adjustments that pass savings to clients, or to reinvestment in workforce transition and capability development. These dashboards should additionally monitor infrastructure concentration ratios — the degree to which operational exposure is accumulating in a small number of AI and settlement providers — and workforce composition metrics that track the evolving ratio of core to modular to AI-agent labor. These instruments will become increasingly material to board oversight as AI integration accelerates and as regulatory scrutiny of AI-related labor and infrastructure practices intensifies.
The scenario architecture presented in this section is anchored to four primary drivers that collectively determine the trajectory of surplus distribution, labor share, and institutional structure across the decade:
The baseline numerical assumptions are drawn from the analysis developed in Sections 3 through 6. The U.S. knowledge-sector wage base is estimated at approximately $4 trillion annually, across professional services, financial services, technology, media, legal, and healthcare administration. AI productivity gains in compressible task domains fall in the empirically observable range of 20–35%, with headcount elasticity (ε) estimated at 0.5–0.8 depending on sector and task structure. Effective labor compression is therefore bounded:
LC_low = 0.5 × 0.20 = 10% LC_high = 0.8 × 0.35 = 28%
Annualized structural surplus formation in the U.S. knowledge sector alone is bounded between approximately $400 billion and $1.1 trillion. The distribution of that surplus — captured by corporate margins (α), micro-enterprise income (β), or infrastructure rent (γ) — determines which of the three scenarios below describes the realized equilibrium. Stablecoin penetration in B2B settlement is assumed to reach 10–30% by 2036, reflecting both regulatory progress and institutional adoption dynamics that are already visible in financial services.
In this scenario, the structural benefits of AI compression distribute broadly across the economy rather than concentrating within a small number of institutional or platform actors. The distribution coefficient vector converges toward (α ≈ 0.30, β ≈ 0.45, γ ≈ 0.25): micro-enterprise operators capture the plurality of surplus, corporate margins compress after an initial expansion phase, and infrastructure rents remain moderate. The enabling conditions for this scenario are rapid open-source AI model diffusion that erodes the pricing power of proprietary frontier model providers, regulatory frameworks that maintain interoperability and prevent anticompetitive platform bundling, and programmable settlement infrastructure that remains accessible at low cost to small operators.
Under this scenario, micro-enterprises capture between 40 and 50 percent of AI-generated surplus, primarily by offering specialized cognitive services — technical analysis, content production, compliance advisory, software development — at cost structures that large institutional employers cannot match. The labor share of national income stabilizes near current levels, in the 53–55 percent range, as wage losses in large-firm employment are partially offset by micro-enterprise income gains, particularly among highly skilled workers with sufficient human and technical capital to operate competitively as independent AI-augmented specialists. Services inflation moderates as competitive pricing pressure from AI-native operators flows through to end-market pricing. GDP growth receives a modest structural uplift of approximately 0.2–0.4 percentage points annually as productivity gains are broadly captured rather than absorbed into rents.
Capital market dynamics under this scenario reflect the compression of traditional institutional margins alongside the proliferation of AI-native small firms. The equity market broadens its participation base, but the dominant institutional structures — large professional services firms, legacy media organizations, conventional consulting models — face sustained multiple compression as their labor cost advantages erode. For institutional investors, the capital allocation implication is to overweight diversified AI-enabled small-operator ecosystems and underweight labor-heavy pyramid structures that have not materially adapted their organizational design.
The condition for this scenario is that the ICI remains moderate and that PRI is sufficient to deter excessive platform rent extraction without dampening AI investment. Achieving this equilibrium requires deliberate policy intervention rather than autonomous market dynamics — it is not the default.
The modal scenario over the 2026–2036 horizon is one in which large institutions adapt meaningfully to AI tools — achieving substantial internal efficiency gains — while simultaneously confronting growing external competition from AI-augmented operators that erodes their historical pricing power. The distribution coefficient vector in this scenario is (α ≈ 0.35, β ≈ 0.30, γ ≈ 0.35): corporate capture and infrastructure rent are both elevated, with micro-enterprises growing but remaining structurally complementary to rather than disruptive of large institutional employers.
The early portion of this scenario (approximately 2026–2029) is characterized by strong corporate margin expansion, as AI tools reduce internal costs faster than external competitive pressure materializes. Institutions that deploy AI broadly in their operations report material labor productivity gains, and the benefits flow primarily to shareholders through margin expansion and buyback acceleration. This phase is already measurably underway across financial services, consulting, and software.
The mid-period (approximately 2029–2033) represents the competitive compression phase. As AI tool quality improves, diffusion broadens, and independent operators accumulate operational experience, the cost advantage of large institutions relative to AI-native smaller competitors narrows. Pricing pressure on standard services — routine legal documents, mid-tier consulting deliverables, standard financial analysis — intensifies. Institutional margins normalize after the initial expansion. Mid-tier firms — those large enough to carry significant labor overhead but without the brand capital or regulatory moat of first-tier institutions — are most structurally exposed during this phase. They bear the full cost of organizational adjustment without the pricing power to maintain margins through the transition.
By the late period (approximately 2033–2036), a new equilibrium is approaching but not yet stabilized. Labor share declines modestly to 50–52 percent nationally, reflecting both the permanent reduction in knowledge-sector employment intensity and the partial offset from micro-enterprise income formation. Infrastructure rents persist at elevated levels, reflecting the continued concentration of AI compute and frontier model provision. For institutional investors in this scenario, the strategic allocation is to overweight AI infrastructure and the AI-integrated incumbents that have demonstrably restructured their operating models, while monitoring the accumulating regulatory risk premium that concentrations of infrastructure rent will generate.
In this scenario, the surplus distribution coefficient vector moves materially toward infrastructure dominance: (γ ≥ 0.50, β ≤ 0.20). A small number of AI model providers and compute platform operators — potentially four to six globally — capture the majority of value created by AI compression, primarily through their ability to price proprietary model access, accumulate proprietary data advantages, and bundle AI services with adjacent platform capabilities in ways that foreclose independent competition.
Under this scenario, micro-enterprise income growth is suppressed. Independent operators access AI tools but cannot compete effectively against platform-integrated service offerings that bundle AI capability with distribution, client relationships, and proprietary data. Labor share declines to 47–49 percent nationally, a meaningful break from post-WWII historical ranges that would constitute a structural political economy shift. Capital deepening accelerates substantially, with the return on AI-intensive capital diverging from the return on human labor at a pace that compounds inequality across wage and wealth dimensions simultaneously.
The capital allocation implication is straightforward in the near term — dominant AI infrastructure providers command premium valuations and generate supernormal returns as long as their platform moats hold — but the medium-term risk is equally clear. By the early 2030s, regulatory backlash is probable, potentially including structural remedies, mandatory interoperability requirements, data portability mandates, and infrastructure-rent taxation. The timing and severity of this regulatory response is the primary uncertainty. Institutions allocating heavily to dominant AI infrastructure under this scenario should therefore maintain active hedges against regulatory intervention risk rather than modeling the platform premium as durable and unconditional.
Weighting the three scenarios by their assigned probabilities, the probability-weighted expectation for the U.S. labor share of national income by 2036 is:
E[LS] = (0.30 × 54%) + (0.45 × 51%) + (0.25 × 48%) ≈ 51.2%
This represents a moderate but meaningful decline from the current 53–55 percent range — consistent with a structural repricing of labor in compressible domains, but not a collapse of the Kaldor stylized fact. The baseline expectation is that labor share declines by two to four percentage points over the decade, with the distribution of that decline concentrated in mid-skill knowledge work. Infrastructure premium formation is likely across all three scenarios; the primary uncertainty is in its magnitude and regulatory durability.
The probability weights attached to each scenario are sensitive to a small number of variables that warrant explicit monitoring. Open-source AI diffusion rates are the single most important variable: rapid diffusion of frontier-quality open-weight models materially increases Scenario One probability and reduces Scenario Three probability. Stablecoin regulatory clarity affects the speed at which programmable settlement penetrates B2B transaction infrastructure, directly influencing micro-enterprise formation rates and coordination cost trajectories. Institutional adaptation velocity — the speed at which large employers redesign organizational structures in response to AI compression — determines whether internal AI gains translate to sustained margin expansion or are rapidly competed away. Antitrust enforcement posture, particularly in the United States and European Union, governs the upper bound of infrastructure rent extraction. And global wage convergence dynamics — particularly the degree to which AI tools enable knowledge workers in lower-wage geographies to compete for tasks previously executed in high-wage domestic markets — introduce additional labor supply pressure beyond what domestic AI adoption alone would generate.
Small changes in any of these variables produce non-linear shifts in branch probabilities. The scenario architecture should therefore be treated as a dynamic framework requiring periodic reassessment rather than a static forecast.
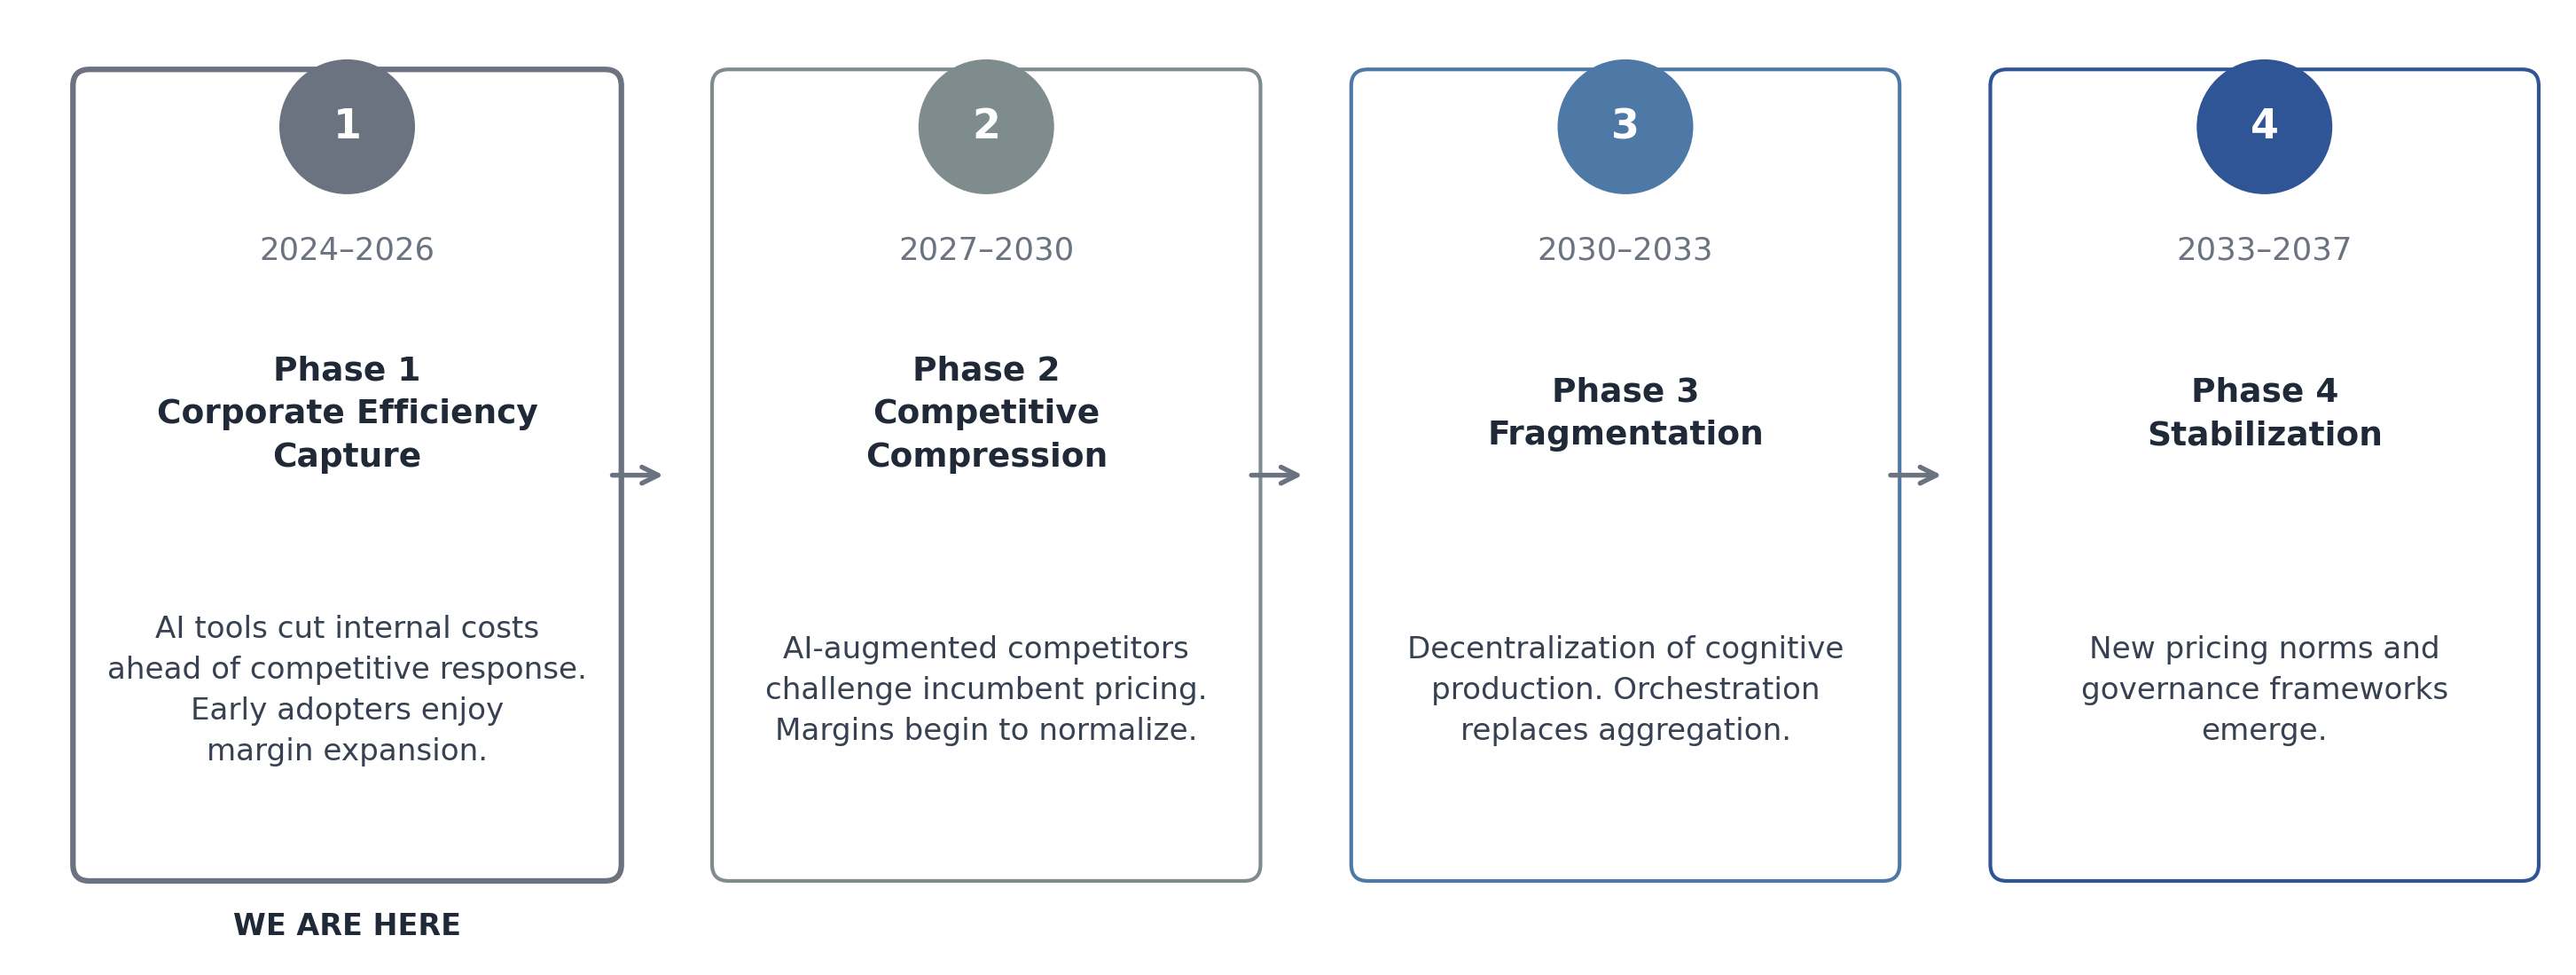
The transition from the pre-AI institutional equilibrium to the eventual post-transition steady state is best understood as a four-phase sequence, with each phase characterized by distinct economic dynamics and strategic implications.
Phase One — Corporate Efficiency Capture is the phase now underway. AI tools reduce internal production costs ahead of competitive response. Institutional adopters report labor productivity gains, margin expansion, and improved output quality in targeted domains. The benefits flow primarily to early-adopting institutions and their shareholders. External competitive pressure from AI-native operators is nascent rather than material.
Phase Two — Competitive Compression begins as AI tool quality, diffusion, and operator experience reach the threshold necessary for external AI-augmented competitors to challenge institutional pricing. Standard professional services — commodity legal work, routine financial analysis, mid-tier consulting — face external competition at cost structures that large institutions struggle to match without restructuring. Margins begin to normalize. This phase is partially observable in 2026 and is likely to intensify through 2028–2030.
Phase Three — Fragmentation involves structural decentralization of cognitive production into smaller AI-native organizational units. Large institutional structures retain core strategic and relationship functions but route increasing volumes of standardized production to modular operators. The firm begins to function as an orchestration layer rather than a full-stack production organization. Organizational boundaries become more permeable and more dynamic.
Phase Four — Stabilization marks the emergence of new market norms, pricing structures, and governance frameworks adequate to the new cost environment. What constitutes standard professional service, what regulatory frameworks govern AI output quality, and what institutional structures attract and retain the highest-caliber talent in the new labor market will have been determined — at least provisionally — by the end of this phase. The timeline for Phase Four stabilization depends heavily on regulatory and institutional adaptation speed, but a reasonable central estimate places it in the 2033–2037 window. Current evidence strongly suggests that Phase One dynamics are mature and Phase Two dynamics are accelerating.
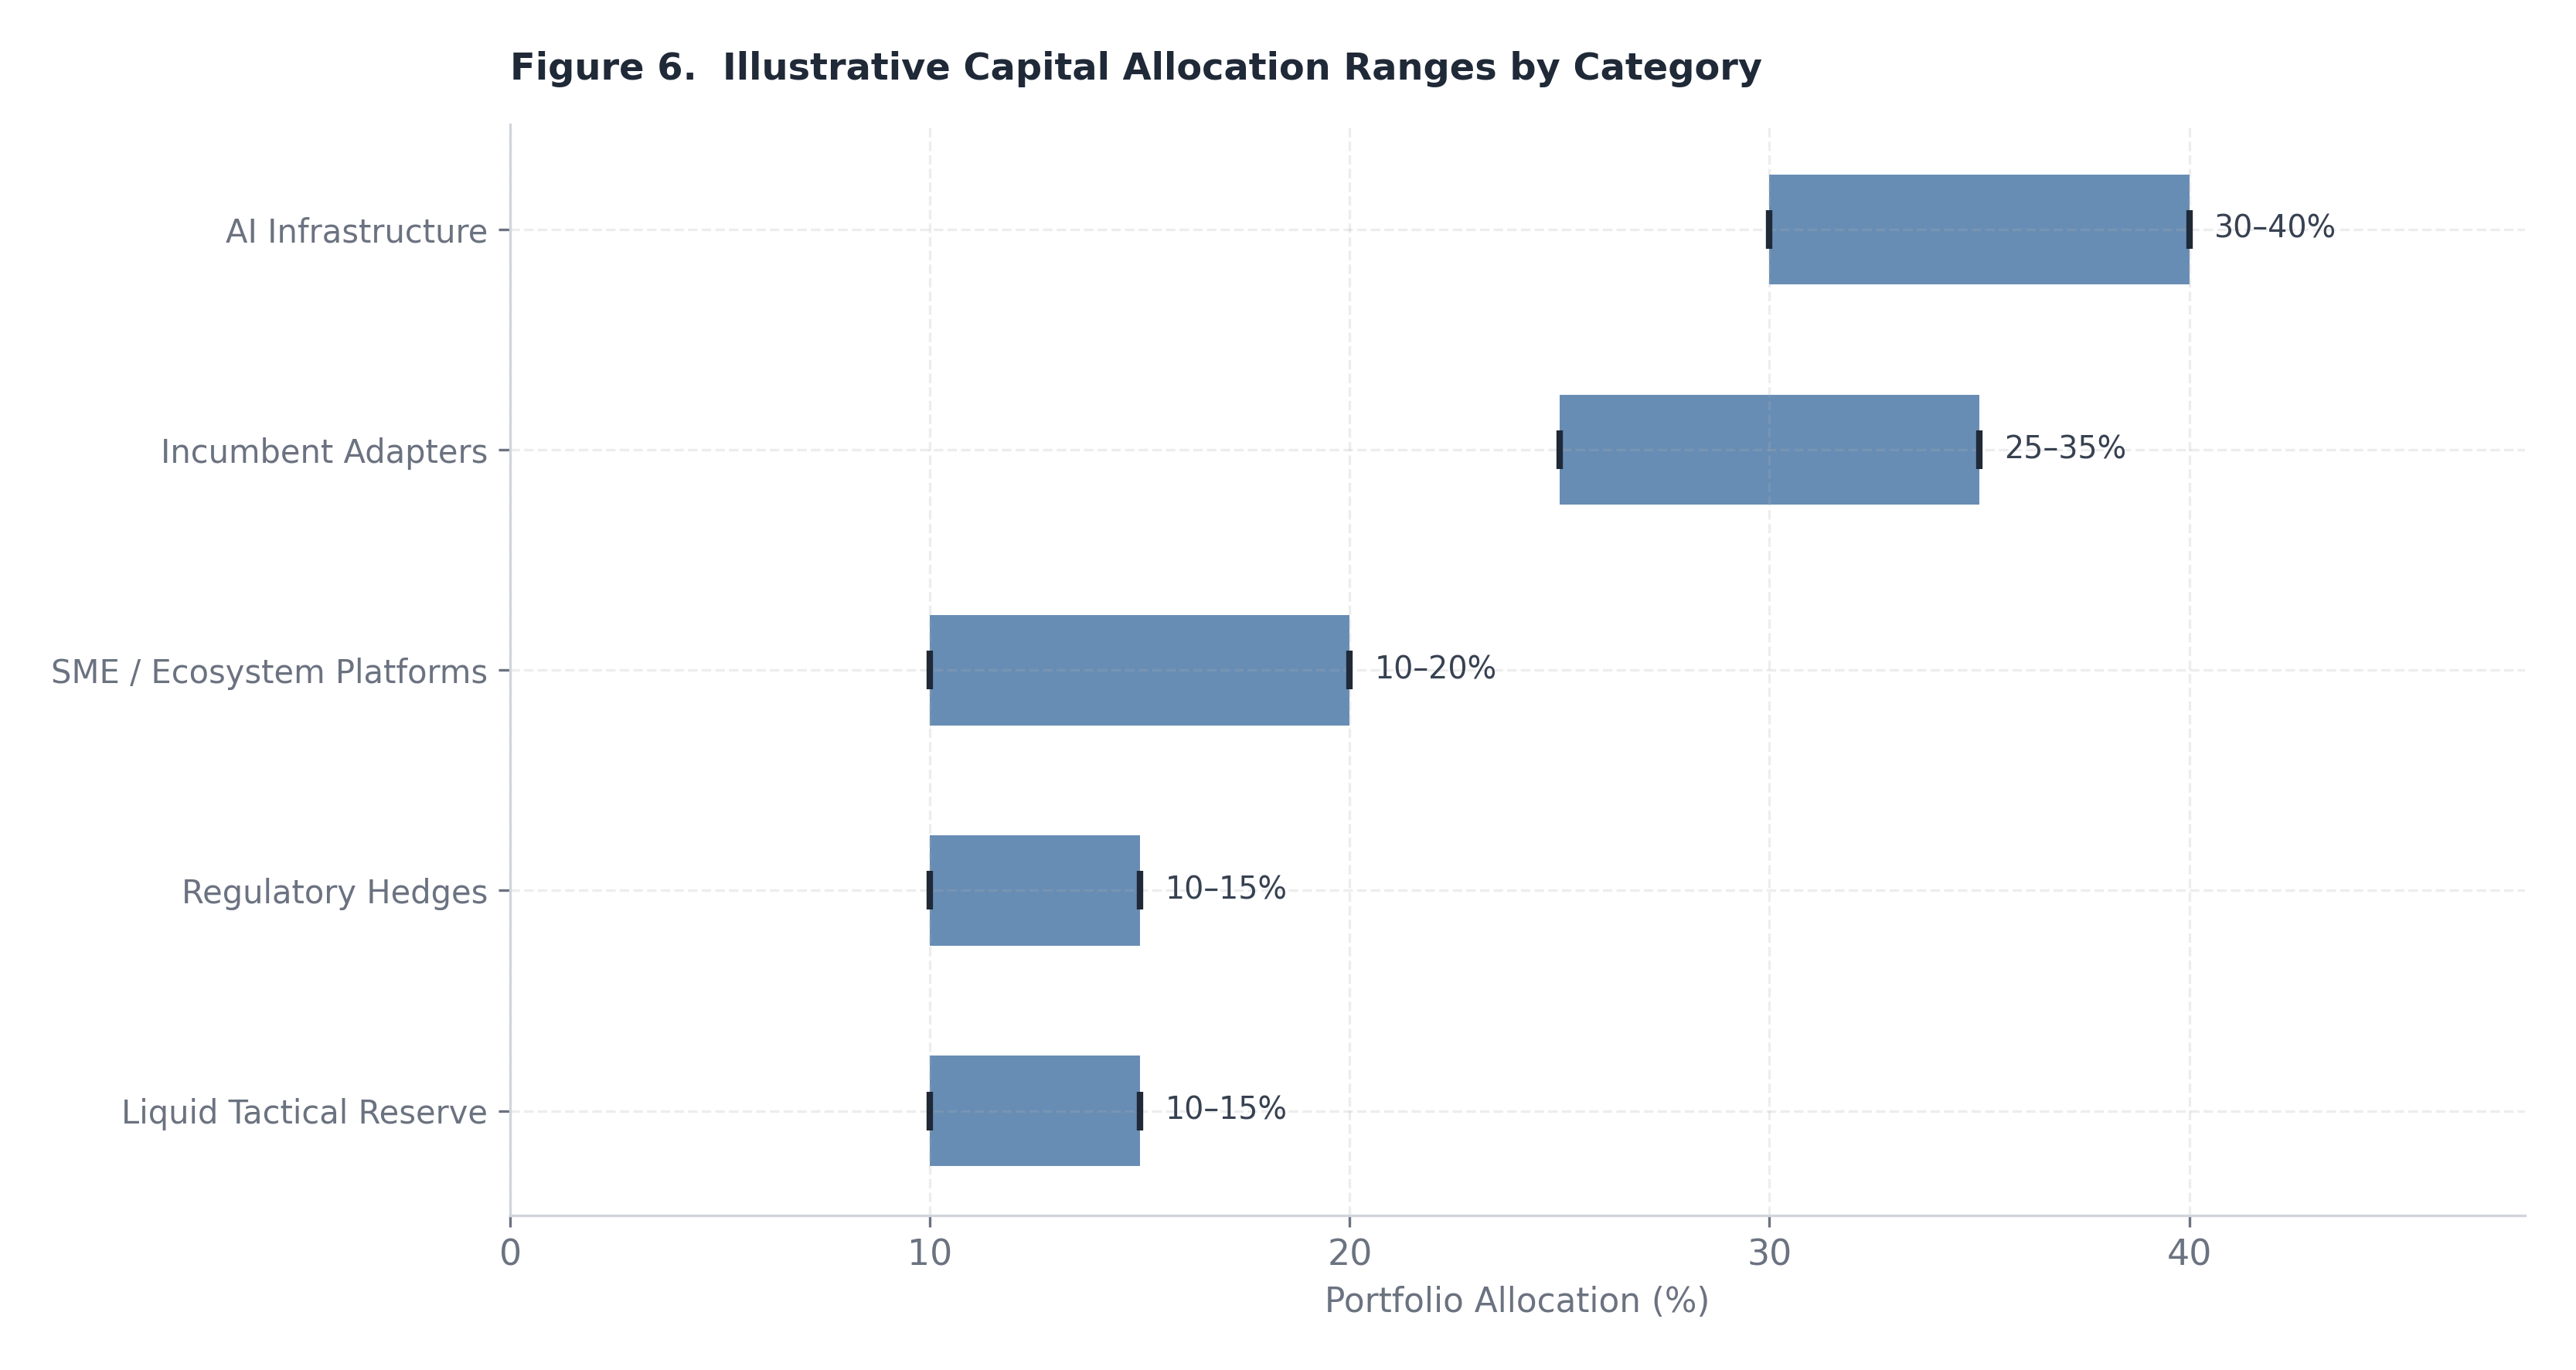
Figure 6. Allocation-range posture aligned with scenario uncertainty and concentration-risk management. ## Probabilistic Allocation Under Scenario Uncertainty
Boards and institutional investors operating in the Convergence Economy face an allocation challenge that conventional portfolio construction methodology is not fully equipped to address. Standard mean-variance optimization assumes reasonably stable asset-class correlations and return distributions. The scenario architecture of Sections 8 and 9 suggests instead that the next decade involves structural branching dynamics, where the return distribution of significant asset categories is contingent on which structural scenario materializes. A technology infrastructure provider commands an entirely different earnings multiple and regulatory risk profile under Scenario Three than under Scenario One; a legacy professional services firm occupies a different strategic position under Scenario Two than it would under a more rapid fragmentation path.
The appropriate response is not to abandon portfolio construction discipline but to adapt it: adopt explicitly probabilistic allocation models that weight positions across the scenario distribution, build in scenario-linked rebalancing mechanisms that respond to observable triggers rather than calendar schedules, and maintain sufficient liquidity reserve to execute opportunistic reallocation when trigger events — regulatory rulings, infrastructure disruptions, labor market inflection signals — materially alter branch probabilities.
An illustrative portfolio posture designed to perform adequately across all three structural scenarios, rather than maximizing expected return under the modal scenario alone, would allocate capital across five functional categories:
Infrastructure and compute exposure (30–40% of risk-weighted allocation) captures the infrastructure premium that is present to varying degrees in all three scenarios. Within this category, diversification across providers — multiple frontier model operators, competing compute hardware ecosystems, and alternative settlement rail operators — is essential to mitigate the concentration risk inherent in single-provider dependency. An institution that maximizes near-term return by concentrating infrastructure exposure in the current dominant providers accepts material drawdown risk in the event of regulatory intervention or competitive disruption. Diversification across the infrastructure layer is the primary internal risk-management discipline within this allocation category.
AI-integrated incumbents (25–35%) represents large institutional employers — across financial services, healthcare systems, legal, and professional services — that have demonstrably restructured their operating models around AI-augmented production rather than relying on undifferentiated workforce scaling. The distinguishing criterion is genuine organizational redesign rather than AI tool adoption at the margin. Institutions that have reduced organizational layers, redeployed capital toward senior talent and AI workflow infrastructure, and redesigned client engagement models for the new cost environment represent this allocation category; institutions that have adopted AI tools while maintaining legacy pyramid structures do not. The alpha in this category is fundamentally an organizational transformation premium.
Ecosystem and SME platforms (10–20%) captures the infrastructure layer that enables micro-enterprise participation: platforms that facilitate accreditation, project allocation, quality monitoring, and settlement for independent AI-augmented operators. This category benefits disproportionately under Scenario One and contributes portfolio convexity relative to infrastructure-concentrated exposure. It also represents the allocation most sensitive to stablecoin regulatory clarity, as programmable micro-payment settlement is foundational to the economic viability of distributed operator networks at scale.
Regulatory hedge exposure is not a traditional asset class but rather a deliberate portfolio allocation to positions that appreciate in regulatory intervention scenarios — which is to say, primarily under Scenario Three dynamics. This may take the form of long positions in regulated-utility AI infrastructure operators whose revenue visibility is enhanced rather than threatened by regulation, or exposure to compliance and governance technology providers whose addressable market expands with regulatory complexity. The regulatory hedge functions as a portfolio insurance instrument against the tail risk of concentrated infrastructure rent followed by abrupt structural intervention.
Liquidity reserve for policy shocks maintains dry powder sufficient to execute meaningful reallocation in the event of discrete regulatory, geopolitical, or technological events that materially shift branch probabilities. The appropriate reserve level depends on institutional risk appetite but should be sufficient to reallocate at least 10–15 percentage points of the total portfolio within a thirty-day window following a trigger event.
The margin cycle embedded in the scenario analysis has direct implications for valuation discipline that institutional investors should apply actively. Phase One dynamics — AI-driven internal cost reduction with limited competitive response — generate margin expansion that equity markets will characteristically capitalize as durable, assigning elevated multiples to firms reporting AI productivity gains. This capitalization may be appropriate if the gains are protected by genuine moats. But for firms whose margin expansion rests primarily on labor cost reduction in compressible task domains with limited barriers to external replication, Phase Two competitive compression will erode those margins within a three-to-five-year window. Valuation models that assume permanent Phase One margins may materially overprice medium-term competitive fragmentation dynamics.
The analytical discipline required is to distinguish between margin expansion that is structurally protected — through trust capital, regulatory moat, data accumulation advantage, or infrastructure ownership — and margin expansion that is structurally exposed — through cost reduction in domains accessible to external AI-augmented operators. The former warrants capitalization at a durable multiple premium; the latter warrants a temporally bounded valuation adjustment that reflects competitive normalization.
AI model providers and compute platform operators currently occupy a structurally advantaged position in the value chain, reflecting high fixed-cost barriers to entry, network effects in data accumulation, and the compounding advantages of scale in model training and deployment. Settlement infrastructure providers benefit from analogous dynamics: liquidity network effects, regulatory relationships, and the switching costs embedded in institutional treasury integration. These structural advantages support a durable rent premium that is visible in current valuations.
The risk is not that these advantages are illusory in the near term — they are real and well-founded — but that their political durability is finite. As γ rises in the surplus distribution model, the visibility of infrastructure rent to regulators, legislators, and public institutions increases proportionally. Historical precedents — from railroad rate regulation in the Progressive Era to telecommunications unbundling mandates in the 1990s — suggest that infrastructure rent extraction above a politically tolerable threshold reliably generates regulatory intervention, the timing of which is uncertain but the direction of which is highly predictable. Infrastructure-heavy allocations should therefore be underwritten with explicit regulatory discount rates applied to the terminal-value component, and held alongside the regulatory hedge positions described above.
Conventional calendar-based rebalancing is poorly suited to an environment characterized by structural branching dynamics and potential regime shifts. The recommended governance practice is to define in advance a set of scenario-linked rebalancing triggers: observable events or data releases that materially update the probability weights assigned to the three structural scenarios, warranting deliberate portfolio reallocation rather than passive drift.
Priority triggers include: stablecoin regulatory clarity events (U.S. federal legislation, Fed or OCC guidance, or equivalent jurisdictional frameworks) that materially accelerate or retard programmable settlement adoption; infrastructure concentration threshold crossings (as measured by ICI), signaling heightened antitrust attention and Scenario Three risk; labor share data releases (Bureau of Labor Statistics functional income accounts, BEA National Income data) that confirm or disconfirm the trajectory predicted under each scenario; enterprise AI adoption rate signals, including technology investment surveys and productivity data releases, that indicate whether Phase Two competitive compression is arriving ahead of or behind central estimates; and major open-source AI model capability releases that materially alter the diffusion dynamics underlying Scenario One.
Across all three structural scenarios, and regardless of which scenario probability weights prove most accurate, a small number of strategic imperatives hold with sufficient consistency to constitute near-universal recommendations.
AI integration is mandatory. The question is not whether to integrate AI into core and peripheral workflows but how rapidly and how deeply. Institutions that delay meaningful integration on the basis of cultural resistance, risk aversion, or strategic ambiguity will accumulate cost and capability disadvantage relative to adaptive peers. The optionality value of integration is declining as the competitive baseline rises.
Settlement modernization is inevitable. Programmable settlement infrastructure will penetrate B2B transactions across professional services, financial services, and healthcare over the next decade. Institutions that treat treasury transformation as a back-office optimization project rather than a strategic structural initiative will find themselves operating with higher coordination costs, lower capital efficiency, and reduced competitive flexibility relative to those that build settlement modernization into their organizational architecture proactively.
Workforce compression in compressible tiers is unavoidable. Across all three scenarios, the headcount intensity of compressible knowledge tasks declines. Managing the workforce transition — timing, severance and transition frameworks, redeployment toward non-compressible strategic functions, and the investment required in the surviving senior-core talent — is a governance imperative that boards cannot defer indefinitely without accumulating both operational and reputational risk.
Infrastructure exposure must be actively monitored. The concentration risk embedded in AI and settlement infrastructure is not self-disclosing; it accumulates quietly until a disruption event makes it visible. Active monitoring of infrastructure concentration ratios, vendor dependency indices, and switching cost trajectories is a governance function, not merely an IT risk management function.
Strategic flexibility outperforms rigid structural defense. The scenario architecture is genuinely uncertain. The institutions best positioned to navigate that uncertainty are not those with the strongest single-scenario conviction but those that have built the organizational and financial capacity to adapt when structural signals indicate that the branch probabilities are shifting. Investment in adaptive capacity — organizational agility, liquidity reserves, modular operating architectures, leadership teams with genuine comfort in uncertainty — is itself a source of durable competitive advantage in an environment defined by structural transition.
The governance and capital allocation imperatives identified in Sections 8 through 10 operate within a policy and regulatory environment that is itself in transition. This section addresses the measurement infrastructure that must evolve to track the Convergence Economy accurately, and the policy levers available to influence its distributional trajectory.
Economic policy is only as good as the data it acts on. The institutional framework for measuring economic activity — the National Income and Product Accounts, the Current Population Survey, the BLS Occupational Employment Statistics series — was constructed during the mid-twentieth century to describe an economy organized around large, employment-based enterprises. That architecture has adapted, incrementally, to capture gig work, platform intermediation, and the service transition. It has not yet adapted to the emergence of AI-augmented micro-enterprises: one- or two-person entities that deploy foundation-model infrastructure to deliver outputs previously requiring professional teams of ten or more.
The consequence is not merely a statistical curiosity. When measurement systems fail to classify a structural shift, the data available to policymakers systematically misrepresents the economy’s condition. GDP accounting attributes productivity gains to the enterprise layer that hosts the AI infrastructure rather than to the operators who direct it. Labor force statistics classify a solo AI-augmented knowledge operator — generating $400,000 in annual revenue through automated document production, financial modeling, or legal analysis — identically to an independent contractor with hand tools and a pickup truck. Business formation statistics count the entity, not its productive capacity or infrastructure leverage ratio.
Four measurement reforms merit prioritization by the Census Bureau, the Bureau of Labor Statistics, and the Bureau of Economic Analysis working in coordination.
First, new categorical distinctions are required within the self-employment and independent contractor universe. The operative distinction is not hours worked or industry sector — it is AI leverage intensity: the degree to which an operator’s output is augmented by foundation-model capability rather than direct labor input. A pilot survey instrument modeled on the Annual Business Survey could capture AI tool expenditure, model API utilization, and output-per-operator estimates for non-employer establishments. This would allow, for the first time, a meaningful separation of subsistence gig work from AI-native knowledge production. The Census Bureau’s Nonemployer Statistics program provides the natural vehicle; the definitional and collection work is achievable within a two-to-three year legislative and administrative horizon.
Second, the BEA should develop a programmable-settlement penetration metric for the B2B commercial payment system. Stablecoin adoption in commercial flows is a leading indicator of coordination cost compression: as on-chain settlement displaces correspondent banking and ACH intermediation, the economic friction embedded in multi-party contracts declines, enabling coordination structures that were previously cost-prohibitive. Tracking this penetration rate — ideally disaggregated by transaction size, sector, and counterparty type — would give policymakers visibility into coordination compression velocity before its effects manifest in labor and output statistics.
Third, a concentration index for AI model providers and programmable-settlement platforms should be published regularly, analogous to the Herfindahl-Hirschman Index used in merger review. The HHI is a straightforward instrument: for n firms with market shares s₁, s₂, …, sₙ, HHI = Σsᵢ². Applied to the AI inference layer and the settlement-platform layer, this index would quantify the infrastructure concentration risk that currently exists only as qualitative concern. The Federal Reserve’s annual Financial Stability Report and the Council of Economic Advisers’ Economic Report of the President are appropriate publication venues.
Fourth, labor share analysis should be published at the sectoral level for professional and business services specifically, rather than relying exclusively on aggregate economy-wide labor share statistics. The broad aggregate — currently approximately 56% of national income — masks substantial within-sector variation. AI-driven productivity gains are concentrated in knowledge-intensive services: legal, financial, consulting, software, research. If labor share within these sectors is declining while aggregate labor share holds relatively stable because of compositional effects elsewhere in the economy, the policy signal is very different from what the headline number suggests.
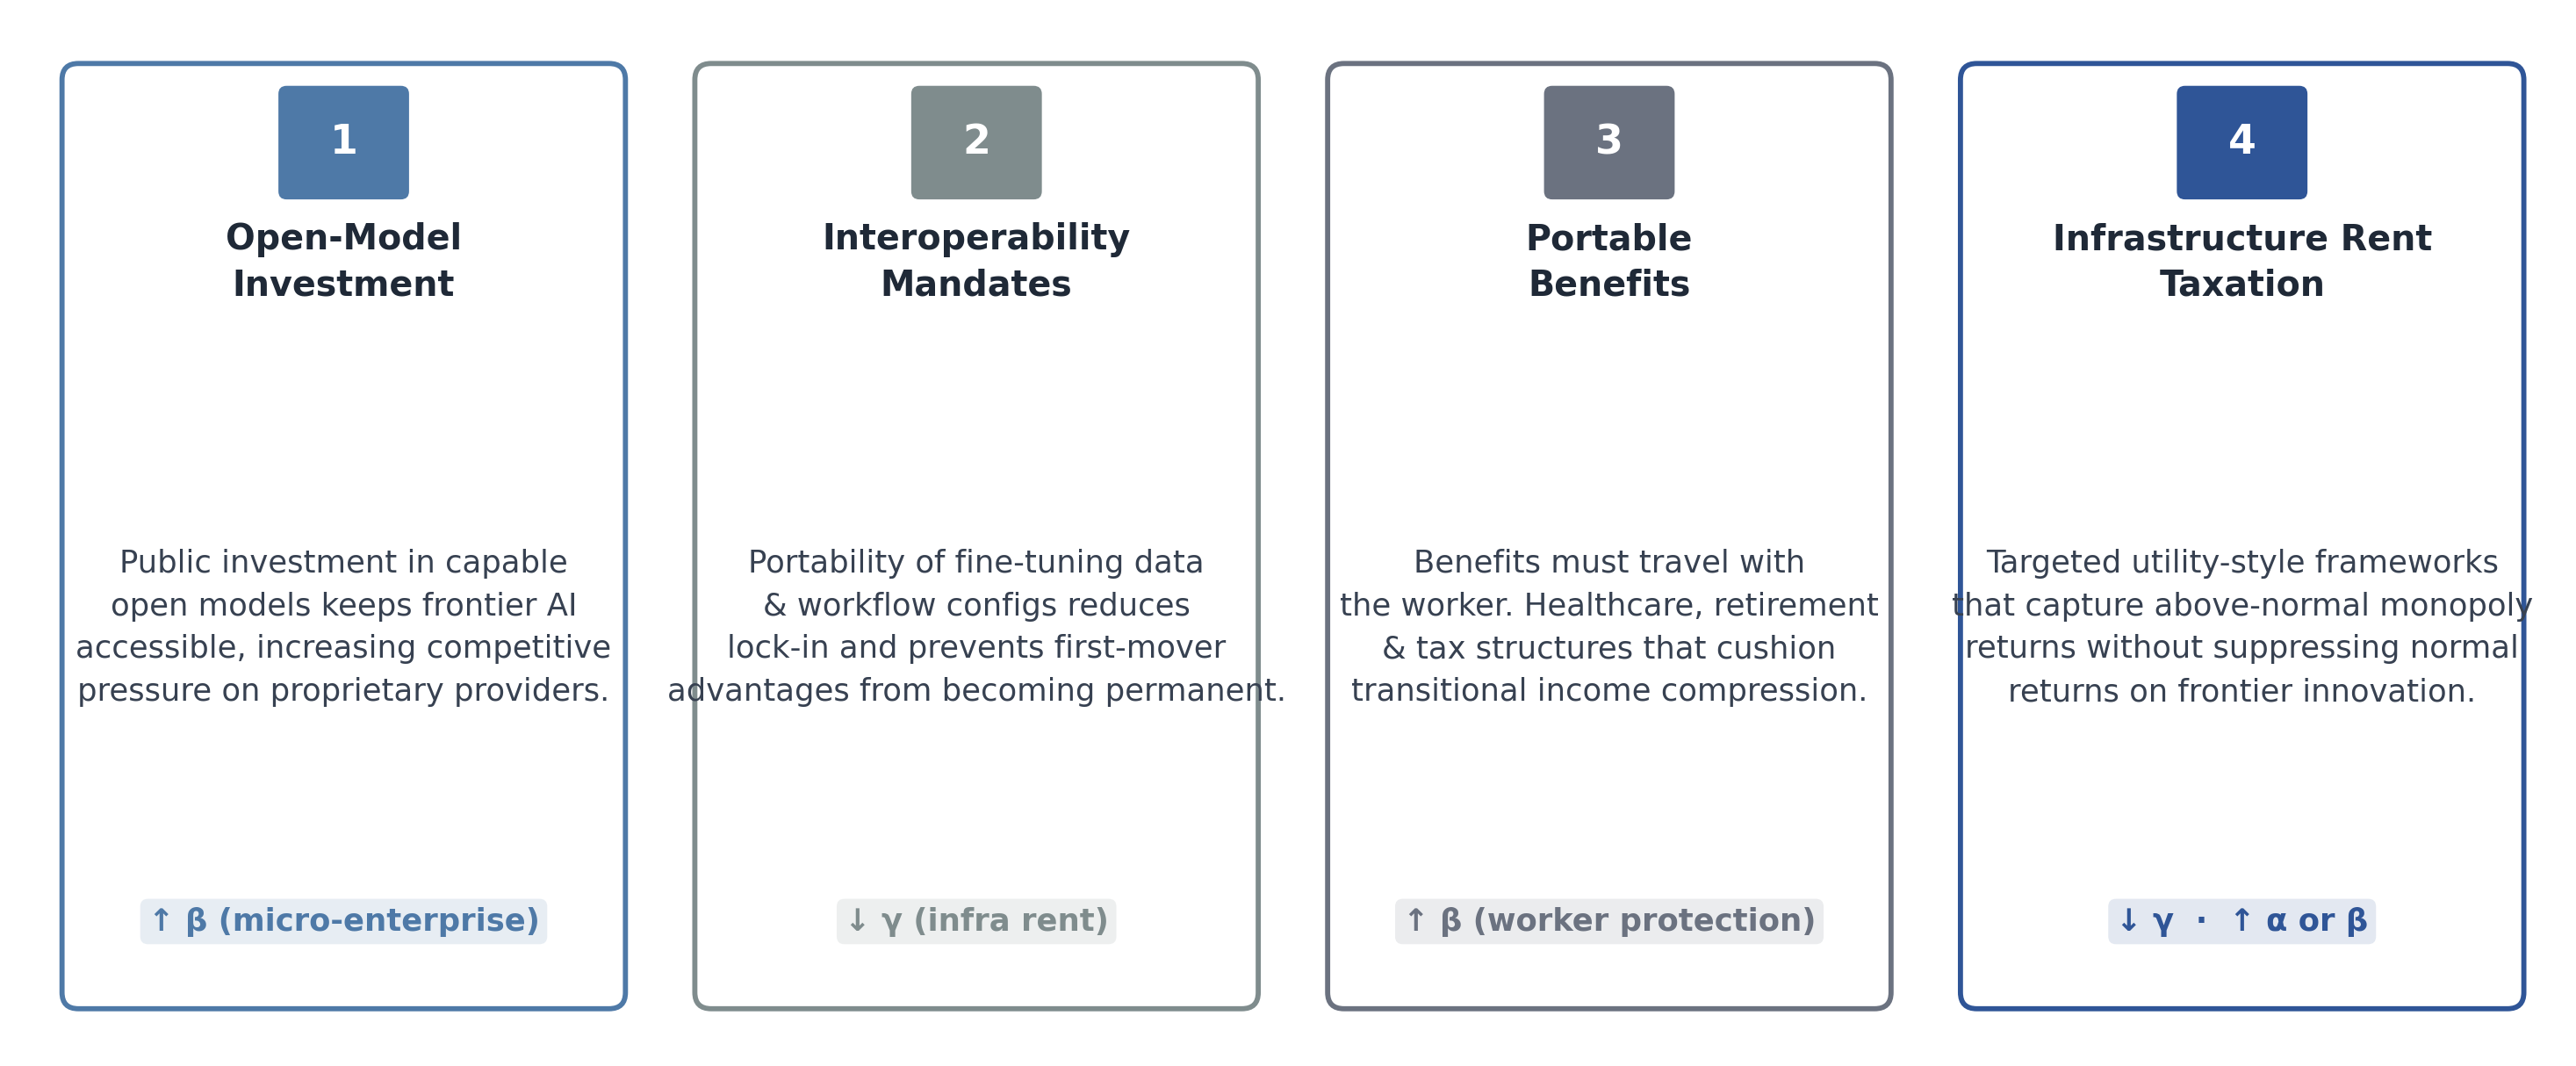
The measurement agenda informs but does not substitute for the policy agenda. Four levers merit substantive institutional attention.
Open-model investment is the most direct intervention available to governments seeking to prevent infrastructure rent concentration from absorbing the surplus generated by AI-productivity gains. In the analytical framework employed throughout this paper, infrastructure rent capture is denoted by the parameter γ; the share flowing to micro-enterprise operators is β. When capable open-source or publicly-funded foundation models are available at or near the frontier of capability, the competitive pressure on proprietary infrastructure providers reduces γ and increases β by expanding the supply of accessible AI infrastructure. The National AI Initiative, DARPA’s AI research programs, and the European Union’s investments under Horizon Europe all represent early-stage versions of this lever. The policy question is whether public investment is sufficient in scale and directed toward general-purpose capability rather than narrow domain applications.
Interoperability mandates address the switching-cost dimension of concentration. An enterprise that has built automated workflows, fine-tuned prompting libraries, and institutional memory on a single proprietary AI platform faces substantial migration costs even when competing platforms offer superior price-performance. Data portability requirements — requiring model providers to export fine-tuning data, system prompt configurations, and workflow integrations in standardized formats — reduce this lock-in and sustain competitive discipline. The parallel to telecommunications unbundling and banking open-API requirements (including the EU’s PSD2 and the U.S. Consumer Financial Protection Bureau’s Section 1033 implementation) is instructive: these mandates did not suppress innovation but did prevent early movers from converting temporary capability advantages into permanent structural barriers.
Portable benefits represent the most significant social policy redesign implied by the Convergence Economy. The American social safety net — healthcare access through employer-sponsored insurance, retirement saving through 401(k) plans, unemployment insurance eligibility tied to employment status — was architected for an economy in which most adults derived income and benefits from a single employer-employee relationship. As knowledge work migrates toward AI-augmented independent operation, this architecture becomes structurally misaligned. The policy agenda here is not novel in concept — portable benefits proposals have circulated in policy discourse since at least the early 2010s — but the urgency has increased materially. If a significant fraction of professional services employment transitions to independent-operator status over the next decade, and if independent operators consistently earn 25–40% less than their corporate equivalents during the transitional period, the absence of portable benefits amplifies that income compression. Reform options range from individual coverage accounts (a portable, employer-and-operator-funded vehicle for healthcare and retirement) to expanded self-employment tax deductions to public option healthcare extensions. The design details are contested; the structural need is not.
Infrastructure rent taxation is the most contentious lever, and appropriately so. If the three-parameter surplus model (corporate α, micro-enterprise β, infrastructure γ) generates persistent concentration in γ — if two or three infrastructure providers extract disproportionate rent from the coordination layer of the economy — then conventional corporate income taxation captures only a fraction of that surplus, because infrastructure providers hold substantial international tax planning flexibility and substantial fixed costs that reduce taxable income. Utility-style regulation, digital services taxes levied on AI inference revenue, or windfall-profit frameworks applied to infrastructure platforms are all theoretically available. The policy risk is suppressing the capital formation that sustains R&D investment at the frontier. The design challenge is constructing a tax instrument that captures economic rent (above-normal returns on a natural monopoly position) without taxing normal returns on innovation. This is tractable in theory; it has proven difficult in practice, as the history of digital services tax negotiations in the OECD attests.
The policy architecture for AI-augmented enterprise and programmable settlement requires regulatory clarity that does not yet exist uniformly across major jurisdictions. In the United States, the GENIUS Act and associated legislative frameworks represent attempts to establish a clear legal category for payment stablecoins — instruments that are neither securities nor bank deposits but that perform a monetary function in commercial settlement. Until that clarity is established, the institutional adoption of stablecoin-based settlement is constrained by legal uncertainty rather than by technical or economic factors. The same dynamic applies to AI liability frameworks: without clear rules for attribution of harm when AI-generated outputs cause financial or legal injury, institutional deployment remains cautious and contract structures remain inefficiently complex.
Labor classification reform is the third dimension of the regulatory agenda. The current binary between employee and independent contractor — with significant intermediate ambiguity in many jurisdictions, as evidenced by the persistent litigation around California’s AB5 — fails to describe the AI-augmented independent operator adequately. New categories, potentially including a dependent contractor or platform worker classification with intermediate benefit rights and tax treatment, are under development in multiple jurisdictions. The EU’s Platform Work Directive represents one approach; its effects on micro-enterprise formation rates in European labor markets will provide useful policy evidence.
International coordination matters because divergent regulatory regimes create arbitrage incentives. An AI-native micro-enterprise is jurisdictionally mobile in a way that a manufacturing plant is not. If one jurisdiction establishes clear, low-friction legal frameworks for AI-augmented enterprise — permissive labor classification, stablecoin settlement legality, clear AI liability rules — while others maintain regulatory ambiguity, enterprise formation will tilt toward the clarity jurisdiction. The economic geography of the Convergence Economy will be shaped, at the margin, by regulatory architecture as much as by infrastructure availability.
The governance architecture and policy levers identified in the preceding sections must contend with a specific set of risks that the Convergence Economy introduces or amplifies. The risk register below provides a structured assessment of the most consequential categories.
The Convergence Economy’s productivity potential is not costless. Dual compression — simultaneous decline in the cost of intelligence and the cost of coordination — generates structural efficiency gains, but it also introduces or amplifies a distinct set of systemic risks. These risks are not independent: several interact through shared causal mechanisms, and the most consequential scenarios involve co-occurrence. The risk register below presents each risk along a likelihood-impact matrix, followed by detailed analysis of the highest-priority categories.
| Risk | Likelihood | Impact | Primary Mitigation |
|---|---|---|---|
| Model hallucination / error propagation | Medium | High | Validation frameworks, audit trails, human-in-loop checkpoints |
| Infrastructure concentration | High | High | Diversification mandates, open-model public investment |
| Smart contract exploit or oracle failure | Medium | High | Formal verification, audit protocols, insurance backstop |
| Rapid labor displacement | Medium | High | Retraining pipelines, portable benefits, transition income support |
| Regulatory shock | Medium | Medium | Scenario hedging, proactive policy engagement |
| Agentic feedback loops | Medium | High | Circuit breakers, mandatory human override thresholds |
| Cyber / systemic liquidity risk | Low–Medium | Very High | Stress testing, multi-rail payment redundancy |
The risk register is a starting point for institutional governance, not a terminus. Each organization deploying AI-augmented workflows and programmable-settlement infrastructure should calibrate these parameters against its own exposure concentration, counterparty profile, and operational dependencies.
The model error risk is structurally different from the software bug risk that institutions have managed for decades. A software defect is typically idiosyncratic: it manifests under specific input conditions, produces a deterministic wrong output, and is diagnosable through conventional testing. A large language model error is probabilistic, context-dependent, and — critically — correlated across all deployments of the same model or model family. When an institution builds financial projection workflows, legal contract generation, compliance documentation, and risk assessment on the same foundation model, it is not managing independent error risks. It is managing a single correlated error distribution that can propagate simultaneously across multiple business functions.
The consequence is that model error in AI-augmented enterprise carries a systemic dimension absent from conventional IT risk. If a widely-adopted model has a systematic bias in financial ratio calculation — not a hallucination in the colloquial sense, but a consistent misapplication of an accounting standard under a particular set of conditions — that error will appear in every financial model built on that infrastructure until it is detected and corrected. In a pre-AI workflow, a spreadsheet error in one analyst’s model does not propagate to another analyst’s independent work. In an AI-augmented workflow where both analysts prompt the same model with structurally similar queries, it does.
The mitigation framework has three components. First, output validation: AI-generated financial, legal, and compliance outputs should be subject to independent numerical and logical verification before they enter automated settlement or regulatory submission workflows. This is not a return to full human replication of AI work — that defeats the productivity gain — but rather a structured sampling and exception-detection protocol. Second, audit trails: institutions should maintain immutable logs of AI-generated outputs, including the model version, prompt structure, and timestamp, so that if a systematic error is later identified, the scope of affected outputs can be bounded and remediation can be targeted. Third, human-in-loop checkpoints at consequential decision nodes: the specific junctures where AI-generated output directly triggers financial commitment, legal obligation, or regulatory filing warrant explicit human review, regardless of automation efficiency incentives.
The concentration risk in AI model provision and programmable-settlement platforms is among the most structurally important risks in the Convergence Economy framework, and it is categorized as High likelihood because the dynamics that produce concentration — network effects, data advantages, compute capital requirements, and switching costs — are endogenous to the technology. They do not require deliberate anticompetitive behavior; they are the natural gravity of the market structure.
The concern is not merely conventional monopoly pricing. It is systemic fragility combined with rent extraction. If three or fewer AI model providers capture more than 70% of enterprise inference workload, and if two or three settlement platforms process the majority of programmable commercial payments, then a technical failure, a regulatory intervention, or a security incident at any of these infrastructure nodes propagates systemically across the enterprises that depend on them. The risk scales non-linearly: because network value in these platforms follows something approximating Metcalfe’s Law — with value proportional to n² for a network of n participants — concentration compounds faster than market share alone would suggest.
The mitigation imperative has two dimensions. For individual institutions, the response is deliberate infrastructure diversification: maintaining interoperability across multiple AI model providers, avoiding deep single-vendor lock-in in settlement infrastructure, and building contingency routing for critical payment flows. For policymakers and regulators, the response is structural: open-model investment to sustain frontier-capable alternatives, interoperability mandates to reduce switching costs, and merger review standards that treat AI infrastructure concentration with the same concern historically applied to telecommunications or financial market infrastructure.
The convergence of AI-augmented enterprise with programmable settlement creates a systemic feedback channel that warrants specific governance attention beyond its treatment as a component of other risk categories. The loop operates as follows: AI agents generate contract terms and financial projections; those outputs trigger smart contract execution and automated settlement; settlement flows affect liquidity positions; liquidity positions influence the financial parameters fed back into AI planning models; and those parameters shape the next cycle of AI-generated outputs. In a stable, well-calibrated system, this loop is efficiency-enhancing. In a stressed or mis-calibrated system, it is amplifying.
The closest historical analogue is the program trading feedback loop that contributed to the 1987 market break, and the more recent dynamics in algorithmic market-making that have produced brief but severe liquidity dislocations. In both cases, automated systems responding to market signals generated by other automated systems produced outcomes that no individual participant intended and no individual system was designed to produce. The AI-settlement analog differs in that it encompasses operational business processes — procurement, invoicing, contract execution — rather than financial market trading, which means the velocity of propagation may be somewhat lower, but the breadth of impact potentially much wider.
Governance responses should include mandatory human override thresholds — defined dollar amounts or contractual commitments above which AI-generated outputs require explicit human authorization before triggering settlement — and liquidity circuit breakers that pause automated payment execution if aggregate outflows exceed predefined bounds within a defined time window. Cross-functional monitoring, linking AI operations teams with treasury and legal functions, is the organizational complement to these technical controls.
The macroeconomic risk associated with rapid labor displacement is not, in this framework, permanent technological unemployment. The empirical record of general-purpose technology transitions — steam power, electrification, information technology — is consistent with eventual labor market recomposition, though the distributional outcomes of those transitions varied substantially. The risk here is transitional velocity: the possibility that AI-driven displacement in knowledge-intensive professional services occurs faster than new employment categories and income structures emerge to absorb displaced workers.
The specific transmission mechanism deserves precision. A mid-career financial analyst whose firm deploys AI-augmented research workflows does not face immediate termination. She faces a restructuring of her role — more time managing AI outputs, less time generating primary analysis — combined with slower headcount growth at the firm level as productivity per analyst increases. At the industry level, this dynamic reduces aggregate demand for entry-level analyst positions, which were historically the training pipeline for senior roles. The pipeline disruption is the structural risk: if the entry-level roles that develop analytical judgment disappear before AI systems can reliably replicate that judgment, the professional services sector faces both a supply disruption (fewer trained senior professionals in ten years) and a transitional income disruption (current entry-level workers who cannot find traditional career entry points).
The policy response — retraining, portable benefits, transition income support — is directionally correct but requires funding, design, and lead time that make near-term adequacy uncertain. The income gap between independent AI-augmented operators and their corporate equivalents (25–40% in central estimates) is the quantitative benchmark against which transitional policy adequacy should be measured.
Regulatory risk in the Convergence Economy is bi-directional. Overly restrictive AI regulation — liability frameworks that make institutions reluctant to deploy AI in any consequential process, stablecoin prohibitions or ambiguities that prevent programmable settlement from scaling — would suppress coordination compression and preserve incumbent firm structures at the cost of productivity gain. Overly permissive regulation — no liability standards, no settlement infrastructure oversight, no labor protection for displaced workers — would allow surplus concentration and distributional harm without governance correction.
The specific regulatory shock risk is not the gradual evolution of policy but a discrete policy event: a major AI-generated financial error that triggers emergency restrictions, a stablecoin collapse that freezes commercial settlement for a period, or a politically motivated labor protection intervention that disrupts micro-enterprise formation. Scenario hedging — building institutional flexibility to adapt workflows across multiple regulatory outcomes — and proactive policy engagement are the institutional responses. Organizations that participate constructively in regulatory design are better positioned than those that simply respond to it.
The Convergence Economy is a structural repricing event, not a business cycle phenomenon. Interest rates rise and fall; equity valuations expand and contract; labor markets tighten and loosen. These cyclical dynamics are superimposed on the structural shift analyzed in this paper, and they will continue to generate short-term noise that obscures the underlying signal. The signal, however, is unambiguous in direction: the cost of intelligence and the cost of coordination are declining simultaneously, and that dual compression is altering the minimum efficient scale of the firm in knowledge-intensive sectors.
The formal proposition, restated: when the marginal cost of intelligence production — the AI inference cost of generating analytical outputs — falls toward cᵢ → 0 for a widening range of tasks, and when the transaction cost of multi-party coordination declines by Δτ through programmable settlement, the optimal firm boundary contracts. The sectors where this contraction is most pronounced are those where production is information-intensive, output is digitally deliverable, and quality verification by counterparties is feasible without physical inspection. Professional services — legal, financial advisory, consulting, software, research, design — are the primary domain. They represent a significant and growing fraction of GDP in advanced economies and employ a disproportionate share of high-income workers.
This is not a story about artificial intelligence in isolation. AI capability without coordination infrastructure produces productivity gains at the individual level but not organizational transformation — professional workers have used increasingly powerful personal computing tools for decades without this producing a structural reconstitution of the firm. Coordination infrastructure without AI capability produces faster settlement of conventional transactions but not a fundamental expansion in what small units can credibly deliver. The convergence of both, in the same institutional moment, is what generates the structural inflection analyzed here.
Technology shapes the production frontier. Institutions, governance, and policy determine where on the distribution of outcomes the economy lands. The productive surplus generated by AI-driven coordination compression — representing real gains in output per unit of labor and capital — must flow somewhere. The three-parameter allocation model (α for corporate profit retention, β for micro-enterprise and independent operator income, γ for infrastructure rent capture) provides the analytical structure. But the values of those parameters are not determined by technology. They are determined by market structure, regulatory design, institutional inertia, and the relative bargaining power of the parties competing to capture the surplus.
This framing has a direct implication for how the next decade of policy debate should be understood. Debates about AI regulation, stablecoin oversight, labor classification, and antitrust in technology markets are not primarily debates about technology policy. They are debates about surplus distribution. The technical questions — how should AI liability be allocated? what constitutes a systemically important settlement platform? when is a worker an employee? — are proxies for a deeper distributional question: who captures the productivity gains from the most significant general-purpose technology transition since the internet?
The answer to that question will shape labor share, capital concentration, income inequality, and political stability through the 2030s in ways that dwarf the direct economic effects of the AI infrastructure investment cycle currently capturing most of the financial market’s attention.
The scenario framework developed earlier in this paper spans a range from concentrated capture (AI productivity gains flow primarily to corporate profits and infrastructure providers, labor share declines, firm structures remain relatively intact) to distributed fragmentation (AI-augmented micro-enterprises capture substantial surplus, firm boundaries contract significantly, labor share stabilizes or recovers). The most probable outcome is a hybrid institutional equilibrium located between these poles, characterized by moderate fragmentation in certain professional service segments, persistent infrastructure premium capture, and significant but incomplete labor market recomposition.
Large firms do not disappear in this equilibrium. They evolve. The economic perimeter of the large firm contracts in execution-intensive, knowledge-commodity domains — the work that is highly structured, repetitive at the cognitive level, and verifiable by output — while its strategic core remains essential. Trust at scale, governance of complex multi-party relationships, capital deployment with legal accountability, and brand credibility as a counterparty signal: these functions become more valuable, not less, as the production of underlying analytical and legal work commoditizes. The large firm’s role shifts from producer to orchestrator — assembling, directing, and standing behind networks of AI-augmented operators rather than employing and supervising analytical labor directly.
This transition is not frictionless. The governance structures of large firms were designed for a world in which strategic direction and execution capacity were co-located within the corporate boundary. As execution capacity migrates outward — retained through contracts and platform relationships rather than employment — the governance architecture must adapt. Boards, risk committees, audit functions, and management accountability structures will require redesign that lags the market adoption of AI-augmented workflows by years, not months.
Against this structural backdrop, the institutions that will shape the next decade rather than react to it share a common set of strategic orientations. They are redesigning governance and organizational boundaries before external pressure compels them to — treating the contraction of firm boundaries as an architectural question requiring deliberate design rather than a series of ad hoc outsourcing decisions. They are reallocating capital decisively toward AI-native capability, understanding that the productivity differential between AI-augmented and conventional knowledge production compounds over time in ways that make delayed adoption increasingly costly. They are monitoring infrastructure exposure and diversifying across model providers and settlement platforms, treating concentration risk in cognitive and coordination infrastructure as a treasury function, not only an IT function.
They are also adapting workforce strategy at structural rather than incremental levels. The question is not how many positions to eliminate through AI efficiency; it is what human judgment, relationship capital, and institutional knowledge remain irreplaceable, and how to build organizational architecture that concentrates human effort at those nodes while AI handles the rest. Finally, they are preserving strategic flexibility across scenario branches — resisting the temptation to optimize fully for the central-case equilibrium in ways that create fragility if the distribution of outcomes proves wider than expected.
The analytical framework developed in this paper generates a set of empirical questions that will be resolved — at least partially — by the evidence of the next five years. The answers to these questions will determine which scenario branch the Convergence Economy traverses and, therefore, what the policy and institutional responses need to be.
What percentage of GDP migrates toward one- to two-person AI-augmented entities? The current estimate suggests that 15–30% of professional services output is addressable by micro-enterprise AI substitution within a decade, but the adoption curve is highly sensitive to enterprise trust thresholds, regulatory clarity, and the rate of open-model capability diffusion. Does labor share stabilize or continue its secular decline? The secular decline in labor’s share of national income that has characterized advanced economies since approximately 1980 has multiple causes; AI-driven productivity concentration in the infrastructure layer would accelerate it, while successful redistribution through micro-enterprise formation and open-model diffusion would attenuate it. The direction of the next decade’s movement on this variable is among the most consequential distributional facts in the political economy of the 2030s.
Does enterprise trust — the counterparty credibility that large firms provide in high-stakes commercial relationships — accelerate or resist fragmentation toward smaller units? Credentialing mechanisms, insurance backstops, platform reputation systems, and verified track records may eventually substitute for firm brand as trust signals, enabling smaller AI-augmented units to compete credibly for engagements currently reserved for large professional service firms. The rate at which this substitution occurs will determine the pace of structural fragmentation. And can open-model diffusion counterbalance infrastructure concentration? If publicly funded and open-source AI development produces models competitive with proprietary frontier capability, the γ parameter remains constrained. If the capital requirements of frontier AI development prove prohibitive for the open ecosystem, concentration hardens and surplus distribution tilts toward infrastructure providers.
The Convergence Economy is not a prediction. It does not assert that large firms will dissolve, that labor markets will stabilize at new equilibria without disruption, or that the risks catalogued in the preceding section will be successfully managed. It is a structural framework — a set of analytical propositions about the direction of change, the mechanisms driving it, the parameters that determine distributional outcomes, and the governance responses that can influence those parameters.
The propositions are falsifiable, and the evidence of the next several years will test them. The framework’s value is not in forecasting the precise endpoint of this transition but in providing decision-relevant structure for the institutions — firms, governments, investors, workers — that must make consequential choices in the interim. In a period of structural transformation, the most dangerous failure mode is not making the wrong bet on a specific scenario; it is failing to recognize that a structural transition is underway at all, and optimizing for a world that is already receding.
The firm evolves from producer to orchestrator. The distribution of the resulting surplus will define the political economy of the 2030s. The decisions made in the next three to five years — about infrastructure investment, regulatory design, organizational architecture, and workforce strategy — will constrain that distribution in ways that prove surprisingly durable. The time for deliberate engagement with this framework is not when the transition is complete. It is now.
The Convergence Economy: Intelligence, Settlement, and the Re-Architecture of the Firm Institutional Research Manuscript — March 2026
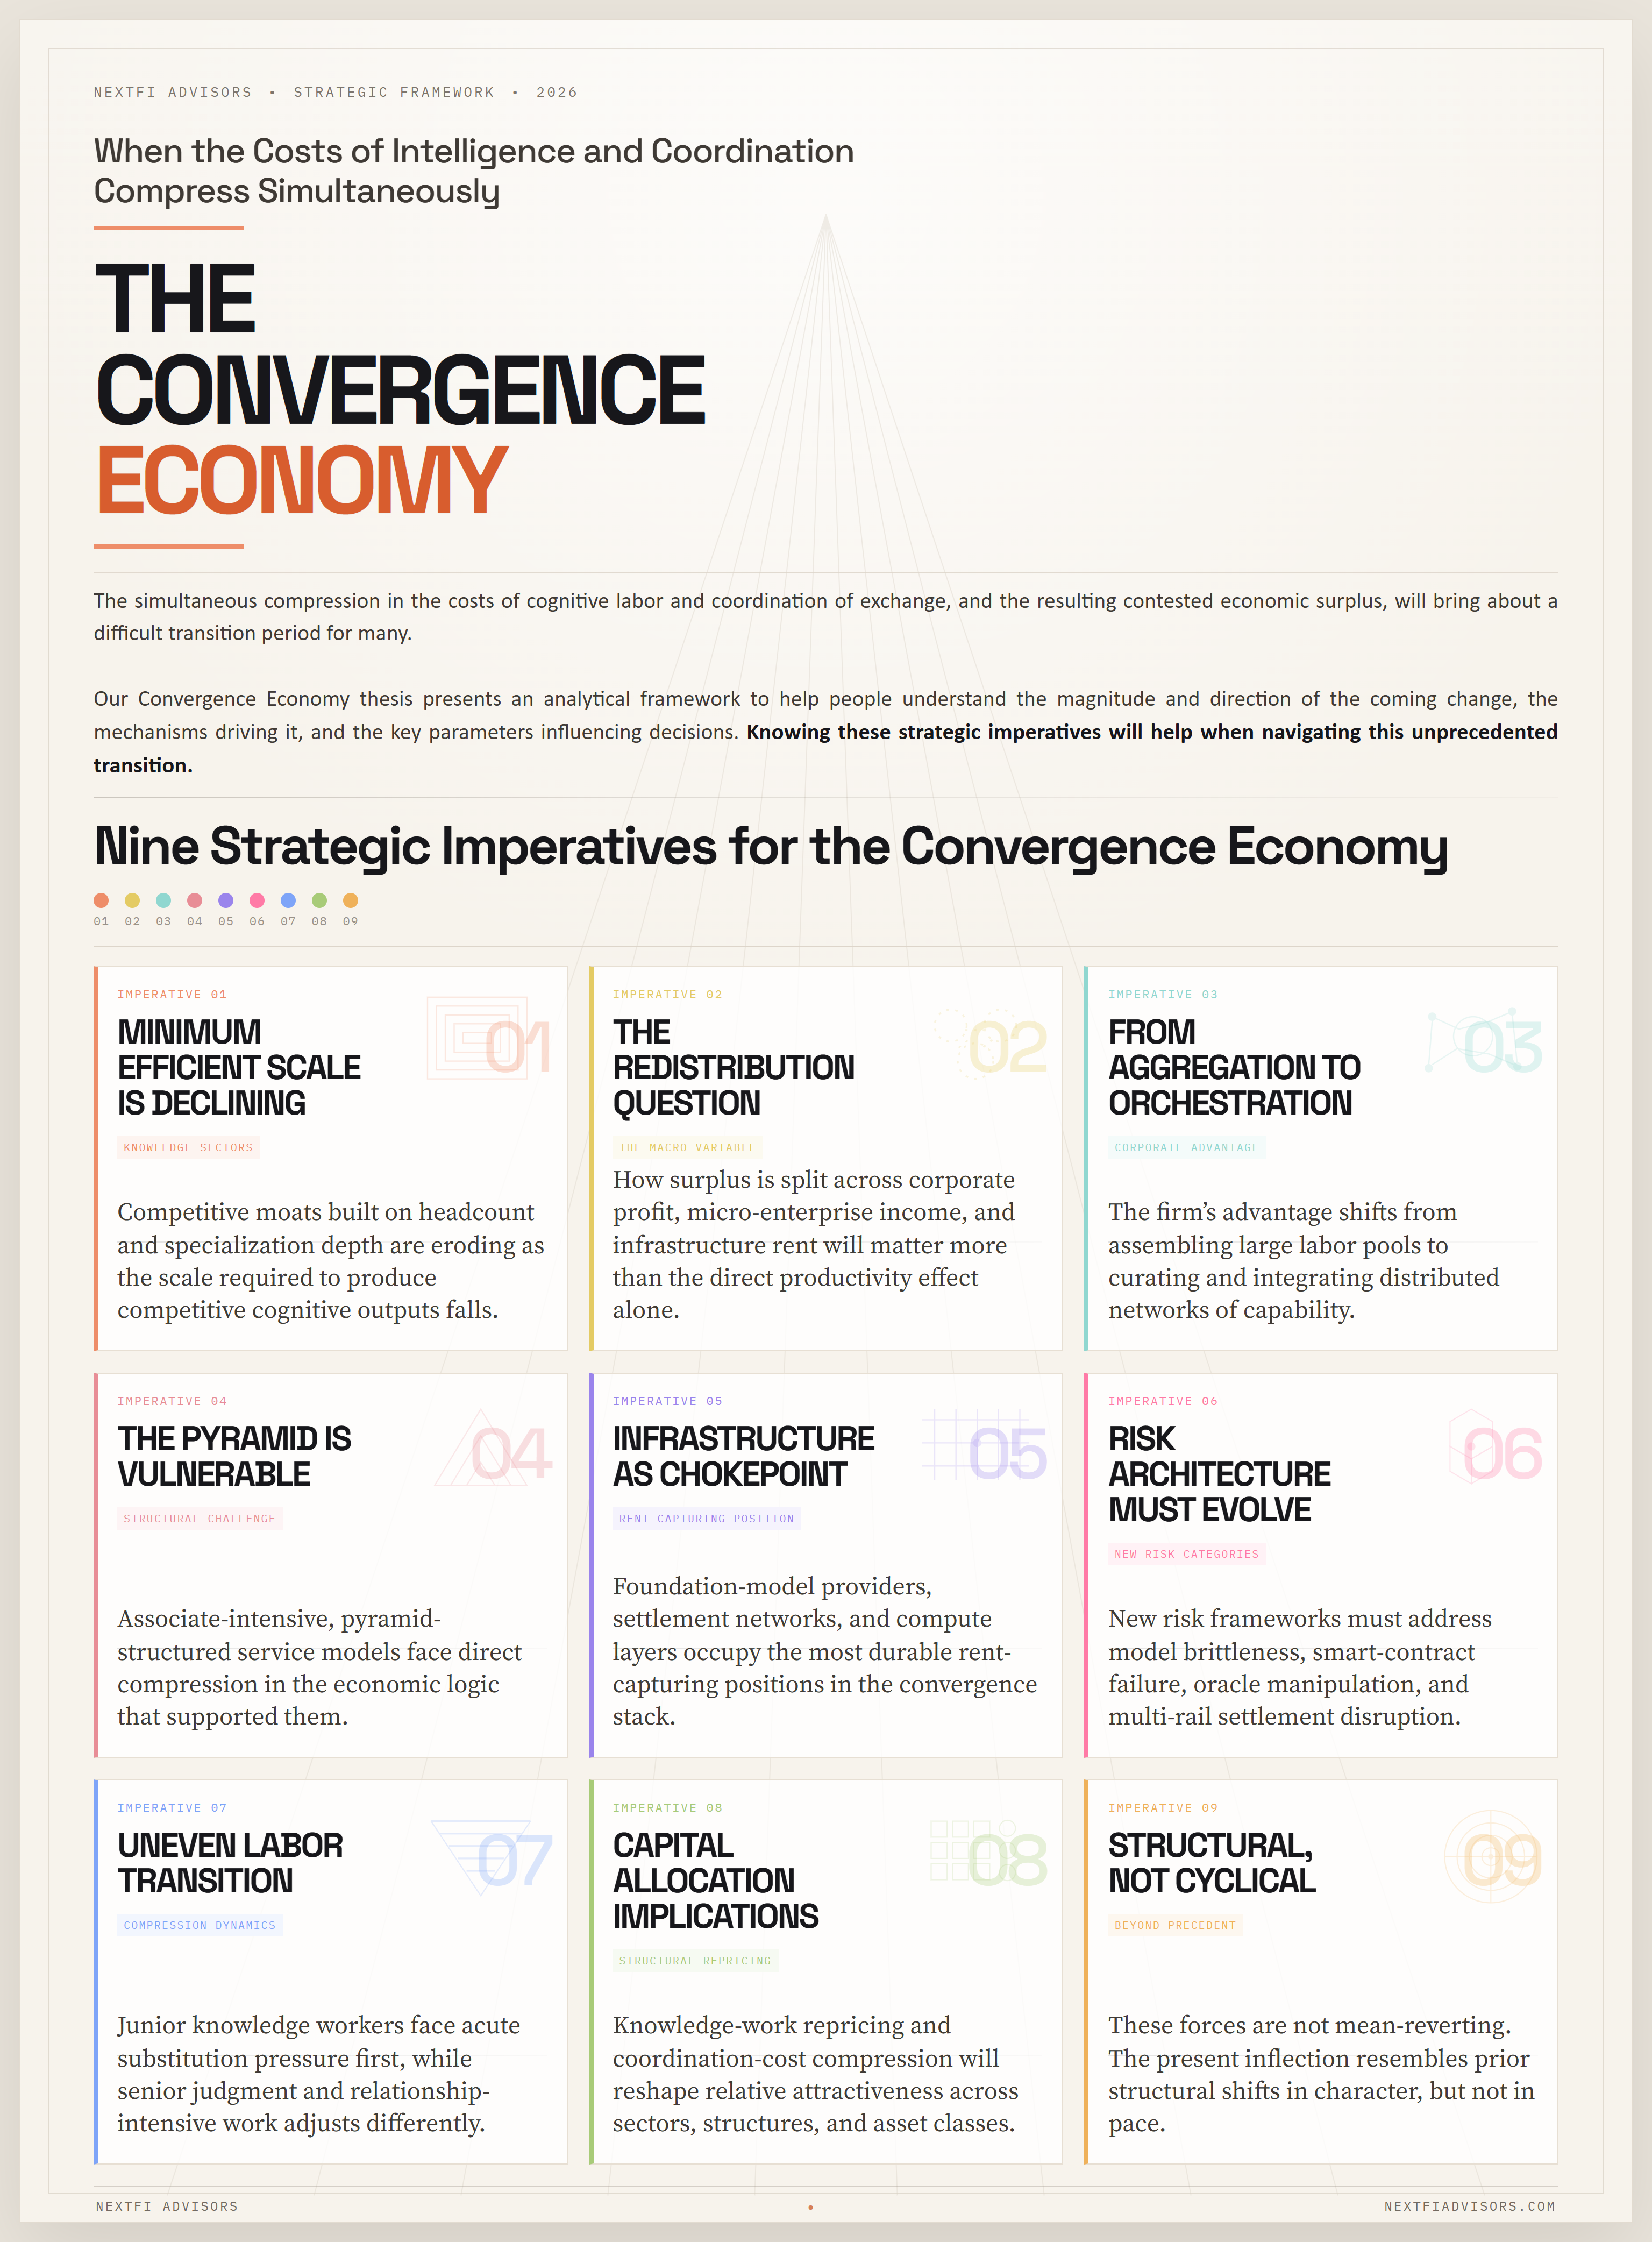
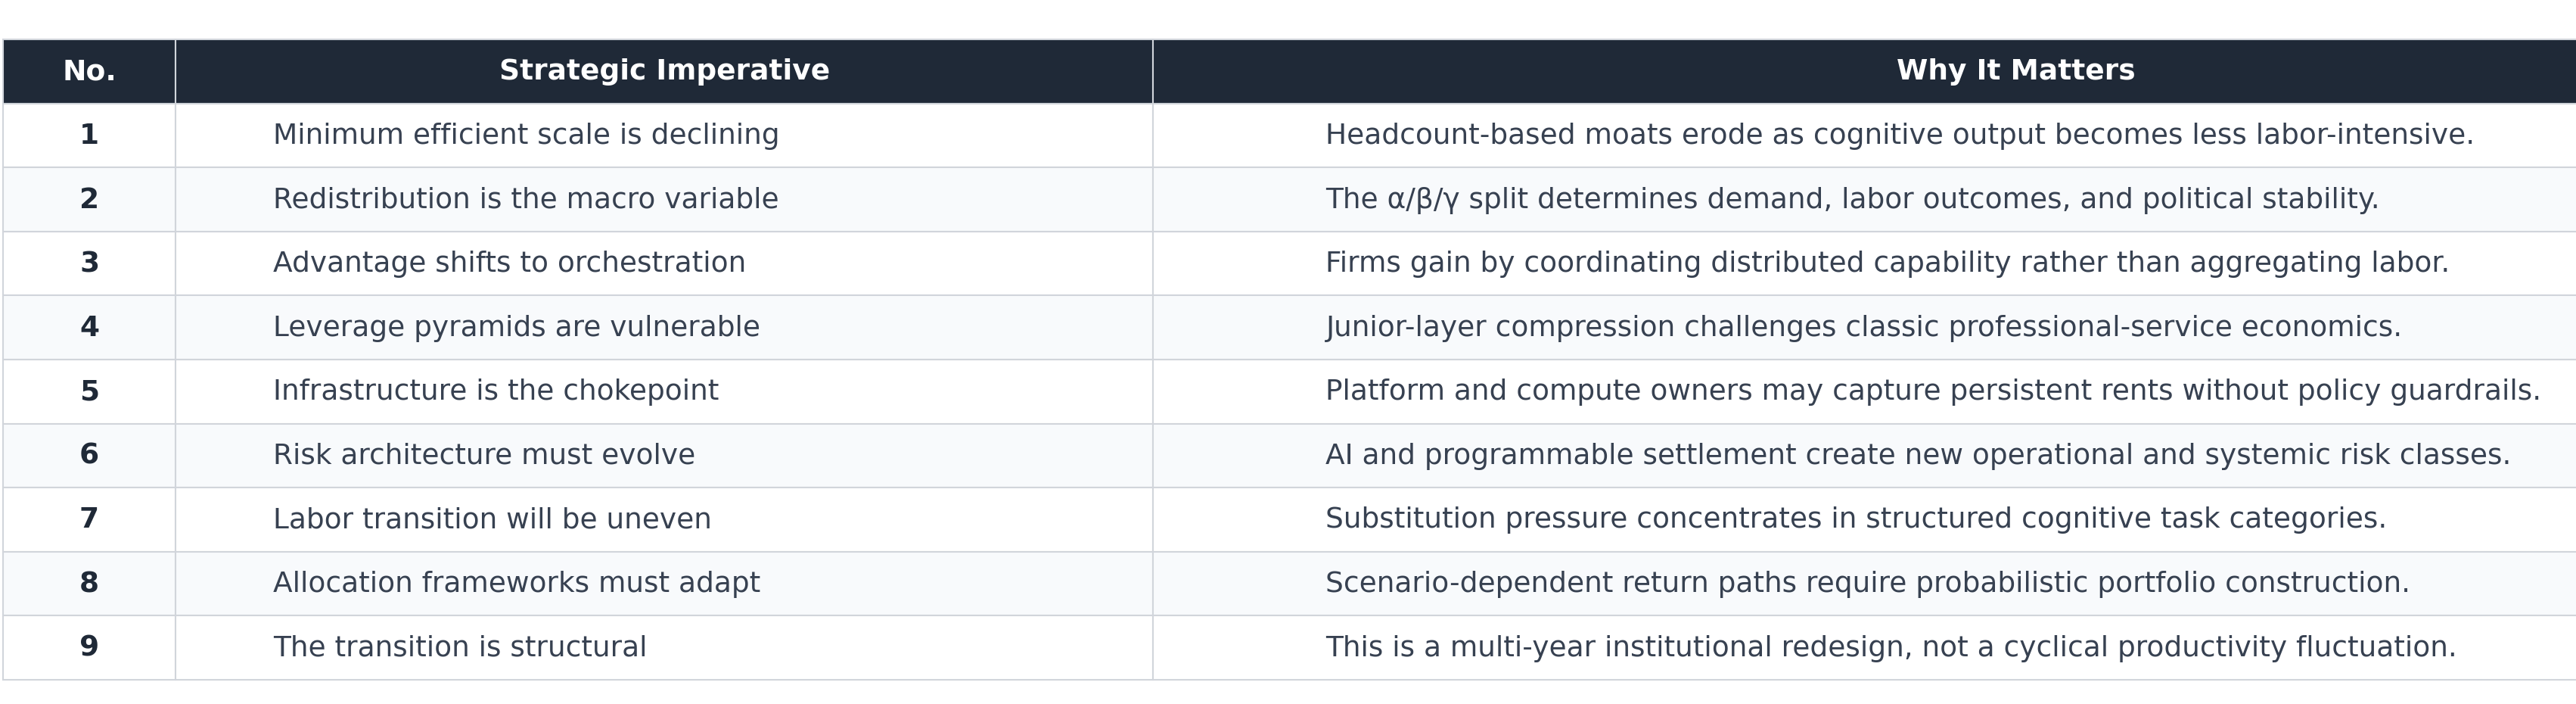
This appendix provides the full citation inventory supporting the empirical claims, theoretical frameworks, and policy analysis presented in this manuscript. Sources are organized thematically and cross-referenced to the relevant sections of the paper. All URLs were verified as of March 2026.
A.1 — Coase, Ronald H. “The Nature of the Firm.” Economica, New Series, Vol. 4, No. 16, November 1937, pp. 386–405. - URL: https://onlinelibrary.wiley.com/doi/10.1111/j.1468-0335.1937.tb00002.x | DOI: 10.1111/j.1468-0335.1937.tb00002.x | JSTOR: 10.2307/2626876 - Cited in Sections 2, 4, and 8 for the foundational proposition that firms exist to minimize transaction costs, and that the firm boundary is determined where internal organization cost equals market transaction cost. The Coasian inequality TC_market > TC_internal governs the make-vs-buy analysis throughout the paper.
A.2 — Williamson, Oliver E. The Economic Institutions of Capitalism: Firms, Markets, Relational Contracting. New York: Free Press, 1985. ISBN: 002934820X. - URL: https://books.google.com/books/about/The_Economic_Institutions_of_Capitalism.html?id=lj-6AAAAIAAJ - Cited in Sections 2, 4, and 8 for the operationalization of Coase’s framework with asset specificity, bounded rationality, and opportunism as drivers of governance structure. Williamson’s three-variable framework predicts optimal boundaries between market and hierarchy and directly underpins the make-vs-buy analysis in the AI-native era.
A.3 — Williamson, Oliver E. Markets and Hierarchies: Analysis and Antitrust Implications. New York: Free Press, 1975. ISBN: 0029353602. - URL: https://archive.org/details/marketshierarchi00will - Cited in Section 2 (supplementary) for the Organizational Failures Framework, explaining when hierarchies outperform markets due to bounded rationality, opportunism, and information impactedness.
A.4 — Stigler, George J. “The Economies of Scale.” Journal of Law and Economics, Vol. 1, October 1958, pp. 54–71. - URL: https://chicagounbound.uchicago.edu/jle/vol1/iss1/4/ | DOI: 10.1086/466541 - Cited in Sections 2 and 8 for the survivor technique identifying minimum efficient scale (MES) and for the premise that AI compression is reducing MES in knowledge-intensive sectors, eroding scale-based competitive moats.
A.5 — Bain, Joe S. Barriers to New Competition: Their Character and Consequences in Manufacturing Industries. Cambridge, MA: Harvard University Press, 1956. - URL: https://books.google.com/books/about/Barriers_to_New_Competition.html?hl=no&id=8QJeAAAAIAAJ - Cited in Section 2 (supplementary) for the first systematic empirical measurement of MES across U.S. manufacturing industries and the establishment of economies of scale as a structural barrier to entry.
A.6 — Metcalfe, Robert. “Metcalfe’s Law After 40 Years of Ethernet.” Computer (IEEE), Vol. 46, No. 12, December 2013, pp. 26–31. - URL: https://dl.acm.org/doi/10.5555/2635508.2635526 | DOI: 10.1109/MC.2013.374 - Cited in Sections 8 and 12 for the n² network value law validating winner-take-most dynamics in platform markets, directly applicable to AI model and settlement infrastructure concentration risk. - Note: For a rigorous critical treatment, see Odlyzko and Tilly (2005): https://pdodds.w3.uvm.edu/teaching/courses/2009-08UVM-300/docs/others/2005/odlyzko2005a.pdf
A.7 — Schumpeter, Joseph A. Capitalism, Socialism and Democracy. New York: Harper & Brothers, 1942 (3rd ed., New York: Harper & Row, 1950). - URL: https://en.wikipedia.org/wiki/Capitalism,_Socialism_and_Democracy - Cited in Section 2 for the process of creative destruction — the mechanism by which new technological combinations incessantly revolutionize economic structure from within — providing the historical framework for the present structural inflection.
A.8 — Bresnahan, Timothy F., and Manuel Trajtenberg. “General Purpose Technologies: ‘Engines of Growth?’” Journal of Econometrics, Vol. 65, No. 1, January 1995, pp. 83–108. NBER Working Paper No. 4148, 1992. - URL: https://econpapers.repec.org/RePEc:eee:econom:v:65:y:1995:i:1:p:83-108 | NBER Working Paper: https://www.nber.org/papers/w4148 - Cited in Section 2 for the definition of General Purpose Technologies (GPTs) — pervasiveness, capacity for improvement, and innovational complementarities — placing AI within the historical canon of economy-wide structural transformations.
A.9 — Arrow, Kenneth J., Hollis B. Chenery, Bagicha S. Minhas, and Robert M. Solow. “Capital-Labor Substitution and Economic Efficiency.” Review of Economics and Statistics 43(3): 225–250, August 1961. [The “ACMS paper.”] - URL: https://www.jstor.org/stable/1927286 | DOI: 10.2307/1927286 - Cited in Sections 3 and 6 for introducing the Constant Elasticity of Substitution (CES) production function Q = A[δK^(-ρ) + (1-δ)L^(-ρ)]^(-1/ρ), the standard framework for modeling AI capital–labor substitutability, with σ = 1/(1+ρ). The paper’s Section 6 CES formulation derives directly from this foundational work.
A.10 — Perez, Carlota. Technological Revolutions and Financial Capital: The Dynamics of Bubbles and Golden Ages. Cheltenham, UK: Edward Elgar Publishing, 2002. ISBN: 9781840649222. - URL: https://www.e-elgar.com/shop/usd/technological-revolutions-and-financial-capital-9781840649222.html | Author publications: https://carlotaperez.org/publications/ - Cited in Section 2 for the five great technological surges framework, identifying the recurring installation-to-deployment pattern in which financial capital drives infrastructure build-out before production capital diffuses the technology economy-wide. Locates the current ICT/AI revolution as the fifth surge, now transitioning from installation to deployment.
A.11 — Azhar, Azeem. The Exponential Age: How Accelerating Technology is Transforming Business, Politics and Society. New York: Diversion Books / Simon & Schuster, 2021. ISBN: 9781635768275. Financial Times Best Business Book of the Year, 2021. - URL: https://www.simonandschuster.com/books/The-Exponential-Age/Azeem-Azhar/9781635768275 | Author site: https://www.azeemazhar.com/bestselling-book - Cited in Section 2 for the concept of “unlimited companies” achieving increasing returns without traditional scale constraints, and for the framework of declining cost curves in compute, storage, and AI that systematically reduce barriers to entry — directly supporting the paper’s MES compression thesis.
B.1 — Chui, Michael, Eric Hazan, Roger Roberts, Alex Singla, Kate Smaje, Alex Sukharevsky, Lareina Yee, and Rodney Zemmel. “The Economic Potential of Generative AI: The Next Productivity Frontier.” McKinsey & Company / McKinsey Global Institute, June 14, 2023. - URL: https://www.mckinsey.com/capabilities/mckinsey-digital/our-insights/the-economic-potential-of-generative-ai-the-next-productivity-frontier | PDF: https://www.mckinsey.de/~/media/mckinsey/locations/europe%20and%20middle%20east/deutschland/news/presse/2023/2023-06-14%20mgi%20genai%20report%2023/the-economic-potential-of-generative-ai-the-next-productivity-frontier-vf.pdf - Cited in Sections 3, 5, 7, and 9 for the $2.6–4.4 trillion annual economic impact estimate; 20–45% productivity gains across knowledge work functions; and the finding that 60–70% of employee time across occupations is addressable by GenAI. Central reference for the surplus formation model and sectoral analysis.
B.2 — Brynjolfsson, Erik, Danielle Li, and Lindsey R. Raymond. “Generative AI at Work.” NBER Working Paper No. 31161. National Bureau of Economic Research, April 2023. - URL: https://www.nber.org/papers/w31161 | DOI: https://doi.org/10.3386/w31161 - Cited in Section 3 for the randomized controlled trial of 5,179 customer support agents showing ~14% average productivity gain from AI assistance, with ~34% gains for novice/low-skill workers. Provides empirical grounding for the heterogeneous compression ratio Δ across skill tiers.
B.3 — Dell’Acqua, Fabrizio, Edward McFowland III, Ethan R. Mollick, Hila Lifshitz-Assaf, Katherine Kellogg, Saran Rajendran, Lisa Krayer, François Candelon, and Karim R. Lakhani. “Navigating the Jagged Technological Frontier: Field Experimental Evidence of the Effects of AI on Knowledge Worker Productivity and Quality.” Harvard Business School Working Paper 24-013, September 2023. - URL (HBS): https://www.hbs.edu/ris/Publication%20Files/24-013_d9b45b68-9e74-42d6-a1c6-c72fb70c7282.pdf | Faculty page: https://www.hbs.edu/faculty/Pages/item.aspx?num=64700 - Cited in Sections 3 and 7.2 for the 758-consultant BCG field experiment: AI users completed 12.2% more tasks, were 25.1% faster, and produced 40% higher quality output; but for tasks outside AI’s “jagged frontier,” AI use reduced performance by 19 percentage points. Anchors the usable-output factor φ and validates the leverage pyramid compression thesis.
B.4 — Peng, Sida, Eirini Kalliamvakou, Peter Cihon, and Mert Demirer. “The Impact of AI on Developer Productivity: Evidence from GitHub Copilot.” GitHub Research, September 7, 2022. - URL: https://github.blog/news-insights/research/research-quantifying-github-copilots-impact-on-developer-productivity-and-happiness/ - Cited in Sections 3 and 7.5 for the randomized controlled experiment with 95 professional developers: Copilot group completed tasks 55% faster (71 min vs. 161 min); statistically significant at P=0.0017. Primary empirical anchor for AI compression in software development.
B.4a — Peng, Sida, et al. “Evidence from a Field Experiment with GitHub Copilot.” MIT Exploration of Generative AI, 2024. (1,974 developers at Microsoft and Accenture.) - URL: https://mit-genai.pubpub.org/pub/v5iixksv - Cited in Section 7.5 for large-scale field evidence: at Microsoft, Copilot users submitted 12.92–21.83% more pull requests per week; at Accenture, 7.51–8.69% more per week. Confirms that productivity gains persist at scale in production environments.
B.4b — “Measuring GitHub Copilot’s Impact on Productivity.” Communications of the ACM, February 2024. - URL: https://cacm.acm.org/research/measuring-github-copilots-impact-on-productivity/ - Cited in Section 7.5 (peer-reviewed corroboration) for the peer-reviewed confirmation of Copilot productivity gains at enterprise scale.
B.5 — Hu, Krystal. “ChatGPT Sets Record for Fastest-Growing User Base – Analyst Note.” Reuters, February 2, 2023. - URL: https://www.reuters.com/technology/chatgpt-sets-record-fastest-growing-user-base-analyst-note-2023-02-01/ - Cited in Section 2 for ChatGPT reaching 100 million monthly active users in two months — the fastest consumer product adoption in history — underscoring the unprecedented diffusion speed of the current AI wave versus the decades-long diffusion of prior GPTs.
B.6 — Perez, Sarah. “OpenAI’s ChatGPT Now Has 100 Million Weekly Active Users.” TechCrunch, November 6, 2023. - URL: https://techcrunch.com/2023/11/06/openais-chatgpt-now-has-100-million-weekly-active-users/ - Cited in Section 2 for the continued adoption acceleration — 100 million weekly active users within nine months of reaching 100 million monthly users — reinforcing the diffusion speed argument in the structural inflection analysis.
B.7 — McKinsey & Company. “The State of AI in Early 2024: AI Adoption Surges but Most Companies See Limited Impact So Far.” McKinsey Global Survey on AI, May 30, 2024. - URL: https://www.mckinsey.com/capabilities/quantumblack/our-insights/the-state-of-ai-2024 - Cited in Section 2 for enterprise adoption: 65% of organizations using GenAI regularly by early 2024, nearly double the 33% from June 2023 (10-month doubling). Provides institutional adoption data corroborating diffusion speed claims.
B.8 — Deloitte AI Institute. “State of AI in the Enterprise 2026.” Deloitte Insights, 2026. - URL: https://www.deloitte.com/us/en/what-we-do/capabilities/applied-artificial-intelligence/content/state-of-ai-in-the-enterprise.html - Cited in Section 2 for 2025–2026 acceleration: worker access to AI tools rose 50% during 2025; 66% of enterprise respondents report productivity/efficiency gains. Confirms the adoption trajectory through the manuscript’s current time horizon.
B.9 — Solow, Robert M. Review of Manufacturing Matters by Cohen and Zysman. New York Times Book Review, July 12, 1987, p. 36. - URL: Not independently digitally archived. Cited via: https://www.nber.org/system/files/working_papers/w19837/w19837.pdf (p. 1, fn. 1) and Brynjolfsson (1993): http://ccs.mit.edu/papers/CCSWP130/ccswp130.html - Cited in Section 5.4 for the canonical productivity paradox observation: “You can see the computer age everywhere but in the productivity statistics.” Provides historical precedent for the lag between demonstrated AI capability and measurable macroeconomic productivity gains discussed in the measurement section. See Methodological Note H.4 below.
B.10 — Brynjolfsson, Erik. “The Productivity Paradox of Information Technology.” Communications of the ACM 36(12): 66–77, December 1993. - URL: http://ccs.mit.edu/papers/CCSWP130/ccswp130.html - Cited in Section 5.4 for the four-part taxonomy of productivity paradox explanations (mismeasurement, implementation lags, redistribution, mismanagement). Remains the standard analytical framework for evaluating whether AI productivity gains will appear in aggregate statistics.
B.11 — Acemoglu, Daron, David Autor, David Dorn, Gordon H. Hanson, and Brendan Price. “Return of the Solow Paradox? IT, Productivity, and Employment in U.S. Manufacturing.” American Economic Review: Papers & Proceedings 104(5): 394–399, 2014. NBER Working Paper No. 19837. - URL: https://www.nber.org/system/files/working_papers/w19837/w19837.pdf - Cited in Section 5.4 for the contemporary application of the Solow paradox to computing, and as the canonical academic source for the Solow 1987 quote (footnote 1). Finds that computer-intensive manufacturing industries experienced no faster TFP growth despite higher IT adoption — a direct precedent for cautious interpretation of AI productivity claims.
B.12 — Katz, Lawrence F., and Kevin M. Murphy. “Changes in Relative Wages, 1963–1987: Supply and Demand Factors.” Quarterly Journal of Economics 107(1): 35–78, February 1992. - URL: https://cpi.stanford.edu/_media/pdf/Classic_Media/Katz_Murph_1992.pdf | DOI: 10.2307/2118323 - Cited in Sections 3 and 6 for the foundational SBTC (skill-biased technological change) hypothesis: sustained demand growth for college-educated workers (~3.3% per year faster than for high school graduates) establishing the framework for analyzing AI’s impact on the wage distribution.
B.13 — Autor, David H., Lawrence F. Katz, and Alan B. Krueger. “Computing Inequality: Have Computers Changed the Labor Market?” Quarterly Journal of Economics 113(4): 1169–1213, November 1998. - URL: https://academic.oup.com/qje/article-abstract/113/4/1169/1917014 | DOI: 10.1162/003355398555874 - Cited in Section 6 for the empirical confirmation linking computer adoption to skill upgrading across industries; computer investment explains 30–50% of the college wage premium increase 1970–1990. Provides the SBTC empirical lineage from which AI wage-distribution analysis descends.
B.14 — Goldin, Claudia, and Lawrence F. Katz. The Race Between Education and Technology. Cambridge, MA: Harvard University Press / Belknap Press, 2008. ISBN: 978-0674028678. - URL: https://www.hup.harvard.edu/books/9780674028678 | Summary: https://irs.princeton.edu/document/571 - Cited in Section 6 for the long-run “race between education and technology” framework: when technology advances faster than educational attainment, the college wage premium rises and inequality widens. Directly applicable to AI as an accelerant of the technology side of this race.
B.15 — Autor, David H., Frank Levy, and Richard J. Murnane. “The Skill Content of Recent Technological Change: An Empirical Exploration.” Quarterly Journal of Economics 118(4): 1279–1333, November 2003. - URL: https://academic.oup.com/qje/article-abstract/118/4/1279/1925105 | DOI: 10.1162/003355303322552801 - Cited in Sections 2 and 6 for the foundational task-based empirical framework: computer capital substitutes for routine cognitive and manual tasks while complementing non-routine analytic and interactive tasks. Explains job polarization and provides the conceptual lineage for analyzing which tasks AI substitutes versus complements.
C.1 — U.S. Bureau of Labor Statistics. “Labor Share of Output Has Declined Since 1947.” TED: The Economics Daily, March 7, 2017. - URL: https://www.bls.gov/opub/ted/2017/labor-share-of-output-has-declined-since-1947.htm - Cited in Sections 6 and 9 for the primary government data on labor share: Q1 1947 at 65.8%, falling below 60% after 2005, with a post-war low of 56.0% in Q4 2011. The 53–55% range cited throughout the paper is consistent with this trajectory.
C.2 — Federal Reserve Bank of St. Louis. “Share of Labour Compensation in GDP at Current National Prices for United States.” FRED Economic Data (BLS data). - URL: https://fred.stlouisfed.org/graph/?g=fvmP - Cited in Section 6 for interactive time-series data confirming the secular decline from ~65% (late 1940s) to the 53–58% range in recent years, depending on measurement approach. Used alongside BLS data for real-time data access.
C.3 — Karabarbounis, Loukas, and Brent Neiman. “The Global Decline of the Labor Share.” Quarterly Journal of Economics 129(1): 61–103, 2014. NBER Working Paper No. 19136. - URL (NBER): https://www.nber.org/system/files/working_papers/w19136/w19136.pdf | REPEC: https://econpapers.repec.org/RePEc:oup:qjecon:v:129:y:2014:i:1:p:61-103 | PDF: http://gabriel-zucman.eu/files/teaching/KarabarbounisNeiman14QJE.pdf | DOI: 10.1093/qje/qjt032 - Cited in Sections 6 and 9 for the global scope of labor share decline (~5 percentage points since early 1980s, observed in 42 of 59 countries), with declining IT/capital goods prices explaining roughly half. Establishes that AI-driven capital price declines will accelerate an already-established structural trend. Estimated elasticity of substitution between capital and labor of ~1.25.
C.4 — Elsby, Michael W.L., Bart Hobijn, and Ayşegül Şahin. “The Decline of the U.S. Labor Share.” Brookings Papers on Economic Activity, Fall 2013, pp. 1–63. - URL: https://www.brookings.edu/articles/the-decline-of-the-u-s-labor-share/ - Cited in Section 6 for U.S.-specific analysis: labor share averaged ~64% historically, fell to 58.3% average in 2010–2012, a 4.5 percentage point structural decline. Attributes ~60% of the decline to offshoring in import-competing industries; provides the U.S. baseline.
C.5 — Piketty, Thomas. Capital in the Twenty-First Century. Trans. Arthur Goldhammer. Cambridge, MA: Belknap Press of Harvard University Press, 2014. ISBN: 978-0-674-43000-6. - URL: https://www.hup.harvard.edu/books/9780674430006 - Cited in Sections 6 and 9 for the r > g framework: the rate of return on capital persistently exceeds the economic growth rate, driving rising wealth concentration and declining labor share over the long run. Documents the post-WWII labor share gains as a historical exception, not a stable equilibrium. AI-driven capital deepening operates within this framework.
C.6 — U.S. Bureau of Economic Analysis. “GDP by Industry.” BEA National Economic Accounts, Annual Data (2022). - URL: https://www.bea.gov/data/gdp/gdp-industry - Cited in Sections 5 and 9 for the derivation of the ~$4 trillion knowledge-sector wage base: Professional, scientific, and technical services (~$2.0T) + Finance and insurance (~$1.2T) + Information (~$0.8T) = ~$4.0T annual compensation. See Methodological Note H.1 for the derivation logic.
C.7 — U.S. Bureau of Labor Statistics. “Employment and Wages Annual Averages, 2022.” Quarterly Census of Employment and Wages (QCEW). - URL: https://www.bls.gov/cew/publications/employment-and-wages-annual-averages/2022/ - Cited in Sections 5 and 9 (corroborating) for total U.S. covered wages of $10.5 trillion for ~150 million workers in 2022. Knowledge-intensive sectors represent approximately 38–40% of this total, consistent with the BEA-derived $4T estimate.
C.8 — McKinsey & Company. “Freelance, Side Hustles, and Gigs: Many More Americans Have Become Independent Workers.” McKinsey & Company, August 22, 2022. - URL: https://www.mckinsey.com/featured-insights/sustainable-inclusive-growth/future-of-america/freelance-side-hustles-and-gigs-many-more-americans-have-become-independent-workers - Cited in Sections 6, 9, 11, and 12 for the 36% independent work rate (~58 million Americans); the full 15.3% self-employment tax burden (vs. 7.65% for employees); and the aggregate 25–40% effective earnings differential from bearing full benefit costs. Key source for the income gap central to the portable benefits policy discussion. See Methodological Note H.2.
C.9 — MBO Partners. “State of Independence in America 2023.” MBO Partners Annual Research Report, 2023. - URL: https://www.mbopartners.com/state-of-independence/2023-report/ - Cited in Sections 6, 7, and 11 for the scale of independent work: 72.1 million Americans worked independently in 2023 (~45% of the U.S. workforce); 26 million full-time (up 73% since 2019). Also cited for the bimodal earnings distribution: 49% cite unpredictable income as primary challenge; 4.6 million independents earn $100,000+ annually.
C.10 — Bhandari, Anmol, Tobias Broer, Per Krusell, and Erik Öberg. “On the Nature of Entrepreneurship.” NBER Working Paper No. 32948, 2025. - URL: https://www.nber.org/be/20251/earnings-self-employed-workers - Cited in Section 6 for the finding that 57% of primarily self-employed individuals earn less than comparable paid employees after controlling for observable characteristics. High earnings variance masks median underperformance — directly supporting the 25–40% income gap framing.
C.11 — Upwork. “Freelance Forward 2023: The Annual Independent Workforce Report.” Upwork Research Institute, 2023. - URL: https://www.upwork.com/resources/gig-economy-statistics - Cited in Section 7 for gig economy scale: 64 million Americans freelanced in 2023 (38% of U.S. workforce); contributed $1.27 trillion to the U.S. economy. 47% provided knowledge-based services. Corroborates MBO Partners data on independent workforce scale.
C.12 — Maister, David H. Managing the Professional Service Firm. New York: Free Press, 1993. ISBN: 0029197821. - URL: https://books.google.com/books/about/Managing_The_Professional_Service_Firm.html?id=xRAhO-RzV5oC | Archive: https://archive.org/details/managingprofessi0000mais - Cited in Sections 3, 7.2, 7.3, and 8 for the Finders/Minders/Grinders leverage pyramid model: Profitability = Margin × Productivity × Leverage. AI compression of the associate/grinder tier directly attacks the leverage ratio, compressing partner profitability and making the pyramid structure structurally vulnerable.
D.1 — Acemoglu, Daron, and Pascual Restrepo. “Artificial Intelligence, Automation and Work.” NBER Working Paper No. 24196, January 2018. In: The Economics of Artificial Intelligence, ed. Agrawal, Gans, Goldfarb. University of Chicago Press / NBER, 2019. - URL: https://www.nber.org/system/files/working_papers/w24196/w24196.pdf - Cited in Sections 3 and 6 for the task-based model distinguishing the displacement effect (AI substitutes for labor in existing tasks) from the productivity effect (lower costs). When elasticity of substitution is low, displacement dominates. Wages can fall even as aggregate output rises if automation outpaces creation of new labor-intensive tasks.
D.2 — Acemoglu, Daron, and Pascual Restrepo. “Automation and New Tasks: How Technology Displaces and Reinstates Labor.” Journal of Economic Perspectives 33(2): 3–30, Spring 2019. NBER Working Paper No. 25684. - URL (full paper): https://shapingwork.mit.edu/wp-content/uploads/2023/10/acemoglu-restrepo-2019-automation-and-new-tasks-how-technology-displaces-and-reinstates-labor.pdf | NBER: https://www.nber.org/papers/w25684 - Cited in Sections 3, 6, and 9 for two key contributions: (1) the baseline elasticity of substitution σ = 0.8 (sourced from Oberfield & Raval, 2014), and (2) the CES production function modeling AI capital and labor with this parameter. At σ < 1, falling AI capital prices reduce labor’s income share even as total output rises. See Methodological Note H.5.
D.3 — Acemoglu, Daron, and Pascual Restrepo. “Robots and Jobs: Evidence from US Labor Markets.” Journal of Political Economy 128(6): 2188–2244, June 2020. NBER Working Paper No. 23285. - URL: https://www.nber.org/papers/w23285 - Cited in Sections 3 and 6 for the empirical calibration of displacement parameters: one additional robot per 1,000 workers reduces the employment-to-population ratio by 0.2 percentage points and wages by 0.42%. Based on IFR robot adoption data matched to commuting zones. Provides the primary empirical anchor for labor displacement velocity estimates.
D.4 — Aghion, Philippe, Benjamin F. Jones, and Charles I. Jones. “Artificial Intelligence and Economic Growth.” In: Agrawal, Gans, and Goldfarb, eds. The Economics of Artificial Intelligence: An Agenda. Chicago: University of Chicago Press / NBER, 2019. NBER Working Paper No. 23928. - URL (slides): https://web.stanford.edu/~chadj/slides-ai.pdf | NBER: https://www.nber.org/papers/w23928 - Cited in Section 6 for the CES framework implication that under σ < 1, non-automatable sectors create a Baumol cost disease dynamic where labor income in those sectors rises but total productivity growth slows. The critical parameter determining long-run labor income distribution is the aggregate elasticity of substitution — directly informing the paper’s complementarity vs. substitution regime analysis.
E.1 — Briggs, Joseph, Devesh Kodnani, et al. “The Potentially Large Effects of Artificial Intelligence on Economic Growth.” Goldman Sachs Economic Research, March 2023. - URL: https://www.brianheger.com/the-potentially-large-effects-of-artificial-intelligence-on-jobs-goldman-sachs-economic-research/ | Related PDF: https://www.goldmansachs.com/pdfs/insights/pages/top-of-mind/generative-ai-hype-or-truly-transformative/report.pdf - Cited in Section 7.3 for the finding that 44% of legal tasks are exposed to AI automation — the highest exposure rate of any major profession — and that 300 million full-time job equivalents globally are exposed to some degree of AI augmentation or automation.
E.2 — Thomson Reuters. “2023 Legal Department Operations Index.” Thomson Reuters, September 21, 2023. - URL: https://www.thomsonreuters.com/en/press-releases/2023/september/thomson-reuters-2023-legal-department-operations-index - Cited in Section 7.3 for legal department conditions: 70% of legal departments report higher matter volumes with flat or declining budgets; 60% believe AI will shift work in-house from outside counsel; 66% operating under budget constraints making AI-driven efficiency a strategic necessity.
E.3 — BCG. “The $200 Billion Agentic AI Opportunity for Tech Service Providers.” Boston Consulting Group, February 20, 2026. - URL: https://www.bcg.com/publications/2026/the-200-billion-dollar-ai-opportunity-in-tech-services - Cited in Section 7.2 for technology service providers expecting 10–20% shrinkage in delivery pyramid (junior staff headcount) within 24 months as agentic AI absorbs entry-level analytical work. Corroborates the leverage pyramid compression thesis with current industry projections.
E.4 — Himmelstein, David U., Terry Campbell, and Steffie Woolhandler. “Health Care Administrative Costs in the United States and Canada, 2017.” Annals of Internal Medicine 172(2): 134–142, January 21, 2020. - URL: https://pubmed.ncbi.nlm.nih.gov/31905376/ | DOI: 10.7326/M19-2818 - Cited in Section 7.6 for the definitive peer-reviewed estimate: U.S. administrative costs total $812 billion in 2017, representing 34.2% of total national health expenditures ($2,497 per capita) vs. Canada’s 17.0% ($551 per capita). See Methodological Note H.3 regarding the distinction between this figure and the commonly cited 25–30% range.
E.5 — Shrank, William H., Teresa L. Rogstad, and Natasha Parekh. “Waste in the US Health Care System: Estimated Costs and Potential for Savings.” JAMA 322(15): 1501–1509, October 7, 2019. - URL: https://jamanetwork.com/journals/jama/fullarticle/2752664 | DOI: 10.1001/jama.2019.13978 - Cited in Section 7.6 for administrative complexity as the single largest category of healthcare waste: $265.6 billion annually (range: $230.7–$492.3B). Total U.S. healthcare waste estimated at $760–935 billion per year. See Methodological Note H.3.
E.6 — Commonwealth Fund. “High U.S. Health Care Spending: Where Is It All Going?” Commonwealth Fund Issue Brief, October 2023. - URL: https://www.commonwealthfund.org/publications/issue-briefs/2023/oct/high-us-health-care-spending-where-is-it-all-going - Cited in Section 7.6 for international comparison: U.S. spends nearly twice the average of comparable high-income countries per capita; approximately 30% of excess attributable to administrative complexity. U.S. administrative spending per capita is 3–4× that of single-payer systems.
F.1 — Federal Reserve Bank of New York. “The Future of Payment Infrastructure Could Be Permissionless.” Liberty Street Economics, November 2025. - URL: https://libertystreeteconomics.newyorkfed.org/2025/11/the-future-of-payment-infrastructure-could-be-permissionless/ - Cited in Sections 4 and 9 for stablecoin transaction growth from $3.29 trillion (2021) to $5.68 trillion (2024) — ~80% increase over three years — after filtering bot-like and wash-trading activity. Provides institutional validation of organic stablecoin adoption in commercial flows.
F.2 — Bloomberg. “Stablecoin Transactions Rose to Record $33 Trillion in 2025.” Bloomberg News, January 8–9, 2026. - URL: https://www.bloomberg.com/news/articles/2026-01-08/stablecoin-transactions-rose-to-record-33-trillion-led-by-usdc - Cited in Sections 4 and 9 for the record $33 trillion stablecoin transaction volume in 2025 (72% year-over-year growth), with USDC leading at $18.3T (56% share). Volume surpassing traditional payment networks’ annual transaction volumes underpins the programmable settlement section.
F.3 — [Author(s)]. “Stablecoins and the US Treasury Market.” Journal of International Economic Law (JIEL), Oxford Academic, advance publication January 2026. - URL: https://academic.oup.com/jiel/advance-article/doi/10.1093/jiel/jgaf050/8439773 | DOI: 10.1093/jiel/jgaf050 - Cited in Sections 4 and 9 for supply growth from $2 billion (2019) to $230+ billion (Q1 2025) and cumulative volume of $45.7 trillion across 305.5 million wallets in the prior 12 months. Notes that stablecoin treasuries now hold U.S. Treasuries comparable in size to sovereign wealth funds.
F.4 — Chainalysis. The 2024 Geography of Crypto Report. Chainalysis Inc., October 2024. - URL: https://www.chainalysis.com/wp-content/uploads/2024/10/the-2024-geography-of-crypto-report-release.pdf - Cited in Section 4 for stablecoins’ dominant share of crypto transaction volume and cross-border commerce adoption in emerging markets: 43% of all crypto transaction value in lower-middle-income countries driven by inflation hedging and cross-border remittances.
F.5 — DefiLlama. Stablecoins Circulating Dashboard. Real-time market data, March 2026. - URL: https://defillama.com/stablecoins - Cited in Sections 4 and 9 for the live stablecoin market cap of approximately $309–320 billion as of early March 2026. USDT dominance: ~59–62% (~$183.5B); USDC: ~$75.2B.
F.6 — CEX.IO Research. “Stablecoin Landscape: What 2024 Reveals About 2025?” CEX.IO, January 31, 2025. - URL: https://blog.cex.io/ecosystem/stablecoin-landscape-34864 - Cited in Section 4 for 2024 full-year statistics: stablecoin supply grew 59% in 2024 reaching $200B+; annual stablecoin transfer volume of $27.6 trillion surpassed combined Visa and Mastercard volume by 7.68%. USDT accounted for 79.7% of trading volume.
F.7 — CoinGecko. 2025 RWA Report. CoinGecko, April 2025. - URL: https://assets.coingecko.com/reports/2025/CoinGecko-2025-RWA-Report.pdf - Cited in Section 4 for fiat-backed stablecoins rising by $97 billion from 2024 to April 2025, reaching $224.9 billion (76% increase). USDT and USDC added $56.3B and $37.6B respectively. Standard Chartered projection of $2 trillion market within three years.
F.8 — Foundation Capital. “The Quiet Crypto Integration.” February 24, 2026. - URL: https://foundationcapital.com/the-quiet-crypto-integration/ - Cited in Sections 4 and 9 for the thesis that stablecoins enable the “agentic transaction economy” — programmable, autonomous microtransactions between AI agents that traditional payment rails cannot support. Frames the convergence of crypto payment rails and AI agent infrastructure as a defining structural shift.
F.9 — Gupta, Kamran, et al. “Banks in the Age of Stablecoins: Some Possible Implications for Deposits, Credit, and Financial Intermediation.” FEDS Notes, Board of Governors of the Federal Reserve System, December 17, 2025. - URL: https://www.federalreserve.gov/econres/notes/feds-notes/banks-in-the-age-of-stablecoins-implications-for-deposits-credit-and-financial-intermediation-20251217.html - See also: Federal Reserve Banks of Boston and New York, Conference on the Financial Stability Implications of Stablecoins, April 2024: https://www.bostonfed.org/news-and-events/news/2024/04/stablecoins-are-growing-rapidly-what-does-this-mean-for-the-stability-of-the-financial-system.aspx - Cited in Sections 7.1 and 12 for systemic risk analysis: stablecoin adoption may reduce bank deposits and create high-volatility wholesale deposit dynamics, with over 60% of funding cost increases transmitted into lending rates. Concentration of systemic vulnerability at banking partners serving major issuers is flagged as an unresolved risk.
F.10 — World Bank. Remittance Prices Worldwide: Making Markets More Transparent, Issue 50, Q2 2024. World Bank Group, Washington, D.C., 2024. - URL (Q2 2024): https://remittanceprices.worldbank.org/sites/default/files/rpw_main_report_and_annex_q224.pdf | Main database: https://remittanceprices.worldbank.org | Q1 2025: https://remittanceprices.worldbank.org/sites/default/files/rpw_main_report_and_annex_q125_1_0.pdf - Cited in Sections 4 and 11 for the primary global benchmark: average cross-border remittance cost of 6.65% (Q2 2024); banks at 13.40%; mobile operators at 3.87% (cheapest traditional channel). Global average as of Q1 2025: 6.49%. G20 target is 5%; UN SDG 10.c target is 3%. Stablecoin rails at 0.5–1% offer an order-of-magnitude improvement.
F.11 — Aldasoro, Iñaki, Matteo Aquilina, Ulf Lewrick, and Sang Hyuk Lim. “Stablecoin Growth – Policy Challenges and Approaches.” BIS Bulletin No. 108. Bank for International Settlements, July 11, 2025. - URL: https://www.bis.org/publ/bisbull108.pdf - Cited in Sections 4 and 11 for quarterly cross-border trading volumes for the two largest stablecoins exceeding $400 billion as of mid-2025, and for the policy warning that broad-based adoption of foreign-currency stablecoins could weaken domestic monetary policy. Notes “same risks, same regulation” faces limitations requiring tailored approaches.
F.12 — Auer, Raphael, Ulf Lewrick, and Jan Paulick. “DeFiying Gravity? An Empirical Analysis of Cross-Border Bitcoin, Ether and Stablecoin Flows.” BIS Working Paper No. 1265. Bank for International Settlements, May 8, 2025. - URL (coverage): https://www.globalgovernmentfinance.com/cross-border-cryptocurrency-stablecoin-flows-bis-working-paper/ | Paper: https://www.bis.org/publ/work1265.pdf - Cited in Section 4 for empirical analysis of cross-border flows between 184 countries, 2017–2024: high traditional remittance costs strongly associated with larger cross-border stablecoin flows from advanced to emerging economies. Geographic distance constrains crypto flows far less than traditional financial flows.
F.13 — BVNK. “The Cost of Cross-Border Payments: Blockchain vs. Traditional.” BVNK Research Blog, 2025. - URL: https://bvnk.com/blog/blockchain-cross-border-payments - Cited in Section 4 for the cost comparison: blockchain-based cross-border payments at 0.5–1% of transaction value versus 2–7% for traditional correspondent banking. Cost advantage largest for SME corridors and emerging market destinations.
F.14 — McKinsey & Company / OpenDue. “Understanding Cross-Border Payments: Trends and Technology in 2025.” OpenDue Blog, 2025. - URL: https://www.opendue.com/blog/understanding-cross-border-payments-trends-and-technology-in-2025 - Cited in Section 4 for corporate payment cost context: large corporations pay 1–3% for cross-border B2B transactions; SMEs pay 5%+. Global B2B cross-border payment volume exceeds $150 trillion annually, implying aggregate cost savings potential in the trillions at stablecoin cost structures.
F.15 — Juniper Research. “B2B Payment Cross-border Transactions to Hit 18bn by 2030.” Press Release, July 28, 2025. Based on B2B Payments Market 2025–2030 research suite. - URL: https://www.juniperresearch.com/press/b2b-payment-cross-border-transactions-to-hit-18bn/ | Full report: https://www.juniperresearch.com/research/fintech-payments/core-payments/b2b-payments-research-report/ | Blog: https://www.juniperresearch.com/resources/blog/are-stablecoins-still-riding-the-wave-of-the-future/ - Cited in Sections 4 and 9 for B2B stablecoin projections: global cross-border B2B transactions to reach 18.3 billion in 2030 (up from 16.3 billion in 2025); financial institution savings from stablecoin use projected at $26 billion in 2028 alone. Total B2B payment value to exceed $224 trillion by 2030.
F.16 — Juniper Research. “B2B Payments to Hit $224 Trillion by 2030 Globally.” Press Release, September 23, 2025. - URL: https://www.juniperresearch.com/press/b2b-payments-to-hit-224-trillion-by-2030-globally-driven-by-emerging-market-expansion/ - Cited in Section 4 for total B2B payment transaction value context: $186 trillion in 2025 growing to $224 trillion by 2030 (20% growth). Provides total addressable market scale for stablecoin settlement penetration analysis.
F.17 — FXC Intelligence. “The State of Stablecoins in Cross-Border Payments: 2025 Primer.” July 17, 2025. - URL: https://www.fxcintel.com/research/reports/ct-state-of-stablecoins-cross-border-payments-2025 - Cited in Sections 4 and 9 for the stablecoin cross-border payment TAM: $16.5 trillion (base case, non-G20 market) to $23.7 trillion (upside, non-G10 market). Actual current stablecoin-based cross-border volume represents less than 1% of the total market, confirming early-stage penetration consistent with Phase One dynamics.
F.18 — Immunefi. Crypto Losses in 2024. Annual Report, 2024. - URL: https://downloads.ctfassets.net/t3wqy70tc3bv/2LqNkvjajiCS5sPJmWLakc/9715af967dd95a55da05d2ad373edb0d/Immunefi_Crypto_Losses_in_2024_Report.pdf - Cited in Section 12 (Risk Register) for smart contract exploit quantification: $1.495 billion in total crypto losses in 2024 across 232 incidents (17% year-over-year decrease from 2023). DeFi accounted for 51.4% of losses. Two major attacks accounted for 36% of annual losses.
F.19 — Chainalysis. “2025 Crypto Theft Reaches $3.4 Billion.” Chainalysis Blog, January 2026. - URL: https://www.chainalysis.com/blog/crypto-hacking-stolen-funds-2026/ - Cited in Section 12 (Risk Register) for 2025 smart contract and infrastructure exploit data: over $3.4 billion stolen in 2025. The Bybit hack ($1.5 billion) represented the largest single crypto theft in history. North Korea (DPRK) alone stole $2.02 billion (51% year-over-year increase).
F.20 — Chainalysis. 2025 Crypto Crime Mid-Year Update. July 17, 2025. - URL: https://www.chainalysis.com/blog/2025-crypto-crime-mid-year-update/ - Cited in Section 12 (Risk Register) for mid-year 2025 update: over $2.17 billion stolen from cryptocurrency services by mid-July 2025, already exceeding all of 2024 and 17% worse year-to-date than 2022 (the prior worst year). Supports the smart contract exploit risk rating in the risk register.
G.1 — U.S. Senate. S.1582 — Guiding and Establishing National Innovation for U.S. Stablecoins Act (GENIUS Act). 119th Congress. Signed into law July 18, 2025. Public Law No. 119-27. - URL: https://www.congress.gov/bill/119th-congress/senate-bill/1582/all-info | Full text: https://www.congress.gov/bill/119th-congress/senate-bill/394/text | White House Fact Sheet: https://www.whitehouse.gov/fact-sheets/2025/07/fact-sheet-president-donald-j-trump-signs-genius-act-into-law/ - Cited in Sections 9, 10, and 11 for the first federal U.S. regulatory framework for payment stablecoins: 100% reserve backing, monthly disclosures, AML obligations, explicit exclusion from securities classification, and stablecoin holder priority in insolvency. The GENIUS Act is the primary stablecoin regulatory clarity event referenced as a portfolio trigger in the capital allocation framework.
G.2 — U.S. House of Representatives. Digital Asset Market Clarity Act of 2025 (CLARITY Act). 119th Congress. Passed House 294–134 on July 17, 2025. Pending in the U.S. Senate as of early 2026. - URL (Morgan Lewis analysis): https://www.morganlewis.com/pubs/2025/06/bipartisan-majorities-in-two-house-committees-vote-to-advance-the-digital-asset-market-clarity-act-of-2025 | Arnold & Porter: https://www.arnoldporter.com/en/perspectives/advisories/2025/08/clarifying-the-clarity-act - Cited in Sections 9 and 11 for the CFTC/SEC jurisdictional framework for digital assets, dividing crypto into digital commodities (CFTC), investment contract assets (SEC), and permitted payment stablecoins (banking regulator). As of early 2026, passed the House but awaiting Senate action.
G.3 — European Parliament and Council of the EU. Directive (EU) 2015/2366 on Payment Services (PSD2). Entered into force January 13, 2016; strong customer authentication fully effective September 14, 2019. - URL (ECB overview): https://www.ecb.europa.eu/press/intro/mip-online/2018/html/1803_revisedpsd.en.html | EUR-Lex official text: https://eur-lex.europa.eu/legal-content/EN/TXT/?uri=CELEX%3A32015L2366 | Summary: https://en.wikipedia.org/wiki/Payment_Services_Directive - Cited in Section 11 for the EU open banking mandate requiring standardized API access to payment accounts and preventing banks from blocking third-party payment providers. Referenced as a successful precedent for interoperability mandates that sustained competition without suppressing innovation.
G.4 — Consumer Financial Protection Bureau (CFPB). Personal Financial Data Rights Rule (Section 1033 of Dodd-Frank, 12 CFR Part 1033). Issued October 22, 2024. First compliance deadline: April 1, 2026. - URL (CFPB official): https://www.consumerfinance.gov/personal-financial-data-rights/ | Executive summary PDF: https://files.consumerfinance.gov/f/documents/cfpb_executive-summary-of-the-personal-financial-rights-rule__2024-10.pdf | Cooley analysis: https://www.cooley.com/news/insight/2024/2024-10-31-cfpb-finalizes-section-1033-rule-on-personal-financial-data-rights - Cited in Section 11 for the U.S. open banking mandate requiring machine-readable access to financial data for consumers and authorized third parties, with phased compliance 2026–2030. Referenced as a parallel to PSD2 in the interoperability mandates policy discussion.
G.5 — California State Legislature. Assembly Bill 5 (AB5). Chapter 296, Statutes of 2019. Signed September 18, 2019; effective January 1, 2020. Codified at California Labor Code § 2775 et seq. - URL (LegiScan): https://legiscan.com/CA/bill/AB5/2019 | Wikipedia: https://en.wikipedia.org/wiki/California_Assembly_Bill_5_(2019) | Ballotpedia: https://ballotpedia.org/California_Assembly_Bill_5_(2019) - Cited in Sections 9 and 11 for the ABC test codifying worker classification in California — the centerpiece of gig economy worker classification debate. Referenced as evidence that the current binary between employee and independent contractor fails to describe AI-augmented independent operators adequately.
G.6 — European Parliament and Council of the EU. Directive (EU) 2024/2831 on Improving Working Conditions in Platform Work (EU Platform Work Directive). Entered into force December 1, 2024. Member States must transpose by December 2, 2026. - URL (EP page): https://www.europarl.europa.eu/legislative-train/theme-a-europe-fit-for-the-digital-age/file-improving-working-conditions-of-platform-workers | Crowell: https://www.crowell.com/en/insights/client-alerts/new-eu-directive-impacting-digital-platforms-and-individuals-working-for-them | Garrigues: https://bloglaboral.garrigues.com/en/riders-law-and-platform-work-directive-challenges-ahead - Cited in Sections 9 and 11 for the EU-wide employment presumption for platform workers, algorithmic transparency requirements, and the regulatory framework covering an estimated 28 million platform workers. Referenced as a policy evidence source on micro-enterprise formation rates under labor reclassification regimes.
G.7 — OECD/G20 Inclusive Framework on BEPS. Two-Pillar Solution to Address the Tax Challenges Arising from the Digitalisation of the Economy. Agreed October 2021. Pillar Two operational in most major economies beginning 2024. - URL (OECD official): https://www.oecd.org/tax/beps/two-pillar-solution-to-address-the-tax-challenges-arising-from-the-digitalisation-of-the-economy.htm | EY (Jan 2025 update): https://www.ey.com/en_gl/technical/tax-alerts/pillar-one-update-from-co-chairs-of-inclusive-framework-on-beps | Grant Thornton (Jan 2026 side-by-side): https://www.grantthornton.com/insights/alerts/tax/2026/flash/oecd-side-by-side-pillar-2 | Tax Policy Center explainer: https://taxpolicycenter.org/briefing-book/what-are-oecd-pillar-1-and-pillar-2-international-taxation-reforms - Cited in Sections 6 and 11 for the 15% global minimum corporate tax (Pillar Two, operational in most economies) and the reallocation of taxing rights to market jurisdictions (Pillar One, pending Senate action). Referenced in the infrastructure rent taxation discussion as a precedent for the design challenges of taxing platform rents.
G.8 — U.S. Census Bureau. Nonemployer Statistics (NES) Program. Annual data available since 1997. - URL (About page): https://www.census.gov/programs-surveys/nonemployer-statistics/about.html | Overview: https://www.census.gov/econ/overview/mu0500.html | FAQs: https://www.census.gov/programs-surveys/nonemployer-statistics/about/faq.html | BLS reference: https://www.bls.gov/opub/hom/opt/data.htm - Cited in Sections 6 and 11 for the primary annual data source on U.S. businesses with no paid employees (sole proprietors, independent contractors). Identified as the natural vehicle for the proposed AI leverage intensity measurement reform, enabling separation of subsistence gig work from AI-native knowledge production.
G.9 — National Institute of Standards and Technology (NIST). Artificial Intelligence Risk Management Framework (AI RMF 1.0). NIST AI 100-1. U.S. Department of Commerce, January 26, 2023. - URL (PDF): https://nvlpubs.nist.gov/nistpubs/ai/nist.ai.100-1.pdf | DOI: https://doi.org/10.6028/NIST.AI.100-1 | NIST AI RMF website: https://www.nist.gov/itl/ai-risk-management-framework - Cited in Sections 8 and 12 for the GOVERN/MAP/MEASURE/MANAGE framework as the leading voluntary U.S. standard for enterprise AI governance. Referenced in the governance section as the applicable compliance alignment framework for AI model risk management.
G.10 — European Parliament and Council of the EU. Regulation (EU) 2024/1689 on Artificial Intelligence (EU AI Act). Published Official Journal July 12, 2024. Entered into force August 1, 2024. Most provisions apply from August 2, 2026. - URL (EUR-Lex official): https://eur-lex.europa.eu/legal-content/EN/TXT/?uri=CELEX%3A32024R1689 | EP overview: https://www.europarl.europa.eu/topics/en/article/20230601STO93804/eu-ai-act-first-regulation-on-artificial-intelligence | White & Case: https://www.whitecase.com/insight-alert/long-awaited-eu-ai-act-becomes-law-after-publication-eus-official-journal - Cited in Sections 9 and 11 for the world’s first comprehensive horizontal AI regulation: risk-based tiered approach from banned applications to high-risk compliance obligations. Maximum penalties of €35 million or 7% of worldwide annual turnover. Applies to any AI system whose output is used in the EU.
G.11 — U.S. Food and Drug Administration (FDA). Artificial Intelligence and Machine Learning Software as a Medical Device Action Plan (AI/ML SaMD Action Plan). Center for Devices and Radiological Health (CDRH), January 12, 2021. - URL (FDA official): https://www.fda.gov/medical-devices/software-medical-device-samd/artificial-intelligence-software-medical-device | Ropes & Gray: https://www.ropesgray.com/en/insights/alerts/2021/02/fda-publishes-action-plan-for-oversight-of-artificial-intelligence-machine-learning-based | Ketryx: https://www.ketryx.com/blog/a-complete-guide-to-the-fdas-ai-ml-guidance-for-medical-devices - Cited in Section 7.6 for the FDA regulatory framework governing AI-enabled Software as a Medical Device (AI/ML SaMD): Predetermined Change Control Plans, Good Machine Learning Practice standards, and the De Novo pathway for novel AI diagnostic devices. Directly explains the “regulation-gated” adoption pattern in healthcare clinical AI.
G.12 — Aspen Institute Future of Work Initiative. “Portable Benefits in Action: A Roadmap for a Renewed Work-Related Safety Net.” Aspen Institute, June 2025. - URL: https://www.aspeninstitute.org/wp-content/uploads/2025/06/Portable-Benefits-in-Action-A-Roadmap-for-a-Renewed-Work-Related-Safety-Net-1.pdf - Cited in Sections 11 and 12 for the portable benefits policy framework: universal portable safety net covering paid leave, unemployment insurance, retirement savings, and worker training. Stresses that employer-tied benefits leave independent contractors without critical protections. Primary policy reference for the portable benefits lever in the policy architecture section.
G.12a — Aspen Institute. “The Original Portable Benefit: A Policy Proposal to Strengthen Social Security and Benefit Portability.” Aspen Institute, May 2025. - URL: https://www.aspeninstitute.org/publications/the-original-portable-benefit-a-policy-proposal-to-strengthen-social-security-and-benefit-portability/ - Cited in Sections 11 and 12 for the estimate of $2 billion annual Social Security shortfall from self-employment tax underpayment by on-demand platform workers. Proposes mandatory contributions from large-scale independent contractor users. - See also: The Century Foundation, “Policies to Protect Workers in the Patchwork Economy: Portable Benefits,” August 2017: https://tcf.org/content/commentary/policies-protect-workers-patchwork-economy-portable-benefits/
The following methodological notes address specific citation and derivation practices for figures that do not appear as direct single-source claims in the scholarly literature.
H.1 — The $4 Trillion Knowledge-Sector Wage Base (Section 5)
No single source directly publishes a “$4 trillion knowledge-sector wage base” figure. The estimate is derived by summing BEA GDP-by-Industry compensation data (Interactive Data Table 6.2D): Professional, scientific and technical services (~$2.0T) + Finance and insurance (~$1.2T) + Information (~$0.8T) = ~$4.0T (2022 data). The proper citation practice is to cite BEA GDP-by-Industry data (Source C.6 above) and present the derivation in a footnote, noting that the figure represents aggregate employee compensation in the three named sectors and excludes other cognitive-labor-intensive occupations in healthcare, education, and government. BLS QCEW 2022 (Source C.7) provides corroborating context: knowledge-intensive sectors account for approximately 38–40% of total covered wages of $10.5 trillion.
H.2 — The 25–40% Independent Worker Earnings Gap (Sections 6 and 11)
No single study directly establishes a “25–40% less” gross income shortfall for independent workers relative to equivalently skilled employees. The defensible framing disaggregates three components: (1) full self-employment Social Security/Medicare tax burden of 15.3% vs. the employee-side 7.65% (net incremental cost: 7.65% of earnings); (2) absence of employer benefit contributions, typically valued at 30–35% of wages per BLS Employer Costs for Employee Compensation; and (3) income volatility risk premium. The combined effective earnings disadvantage equates to the 25–40% of comparable gross employee compensation range. Authors should cite McKinsey (2022) (Source C.8) for the independence burden framing and BLS ECEC data for the benefit valuation component.
H.3 — Healthcare Administrative Cost Discrepancy (Section 7.6)
The manuscript’s healthcare section references administrative overhead as “above 25–30 percent.” This is a conservative citation practice: Himmelstein et al. (2020) (Source E.4) establishes the figure at 34.2%, which is the most rigorous peer-reviewed estimate. The JAMA (Shrank et al., 2019) (Source E.5) waste analysis captures administrative complexity as a component of the waste estimate at a lower relative figure because it uses a different denominator and methodology. Authors who prefer the more conservative citation should use Shrank et al. and note that the figure represents the administrative waste fraction of total expenditure rather than the share of all administrative spending. The 34.2% Himmelstein figure is the more defensible upper bound; the 25–30% range is a commonly used approximation that understates the peer-reviewed finding.
H.4 — The Solow 1987 Quote (Section 5.4)
The original Solow productivity paradox quote — “You can see the computer age everywhere but in the productivity statistics” — appeared in the New York Times Book Review, July 12, 1987, and is not independently digitally archived. Standard academic practice is to cite the quote via Brynjolfsson (1993) (Source B.10) or Acemoglu et al. (2014) (Source B.11, footnote 1), both of which cite the original New York Times Book Review publication with full bibliographic detail. Authors should not cite the quote as a direct internet-accessible source; the chain of academic citation is the appropriate attribution method.
H.5 — The σ = 0.8 Elasticity Parameter (Section 6)
The baseline elasticity of substitution σ = 0.8 cited by Acemoglu and Restrepo (2019) (Source D.2) originates from a separate study: Oberfield, Ezra, and Devesh Raval. “Micro Data and Macro Technology.” Econometrica 89(2): 703–732, 2021. NBER Working Paper No. 20452. DOI: 10.3982/ECTA12807. Available at: https://www.nber.org/papers/w20452. Authors requiring precision in citing the elasticity parameter should cite Oberfield and Raval (2021) as the primary source of the σ = 0.8 estimate and cite Acemoglu and Restrepo (2019) as the paper that adopts and applies this parameter in the AI-labor substitution context.
Appendix compiled March 2026. All URLs verified at time of compilation. For academic citation, DOIs and publisher URLs take precedence over PDF mirror links. Sources classified as “primary” reflect direct empirical measurement or original theoretical contribution; sources classified as “supplementary” provide corroborating evidence or contextual analysis.